Articles
| Name | Author | |
|---|---|---|
| Not just a node on your network – Aircraft Connectivity | Walt Akerley Technical Director, Airline Systems for Aeromechanical Services (FLYHT) | View article |
| IT and the pendulum; The balance between IT, Flight Operations and Engineering is a critical one | Shaun Rattigan, Technical Director, Aviation Intelligence | View article |
| A New Approach to Cost of Weight (COW) | Stef Denuwelaere, CEO, Leading Edge | View article |
| American Airlines, iPad enabled, FAA approved | Hank Putek Jr., B-777 Pilot, American Airlines and Allied Pilots Association Safety Committee | View article |
| The world according to IT & me… | Paul Saunders | View article |
A New Approach to Cost of Weight (COW)
Author: Stef Denuwelaere, CEO, Leading Edge
SubscribeA New Approach to Cost of Weight (COW)
The Breguet Range Formula, as Stef Denuwelaere, CEO of Leading Edge explains, introduces more factors to calculate a more reliable Cost of Weight
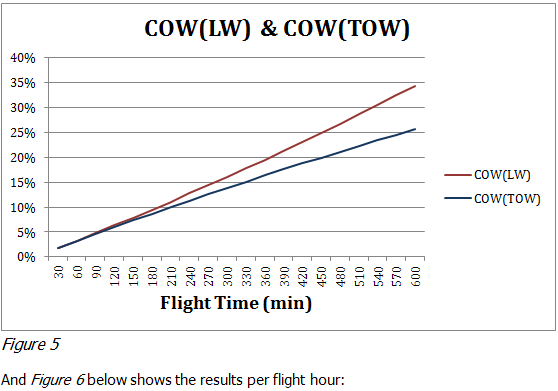
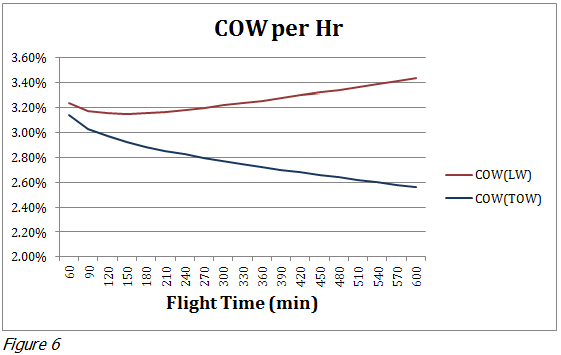
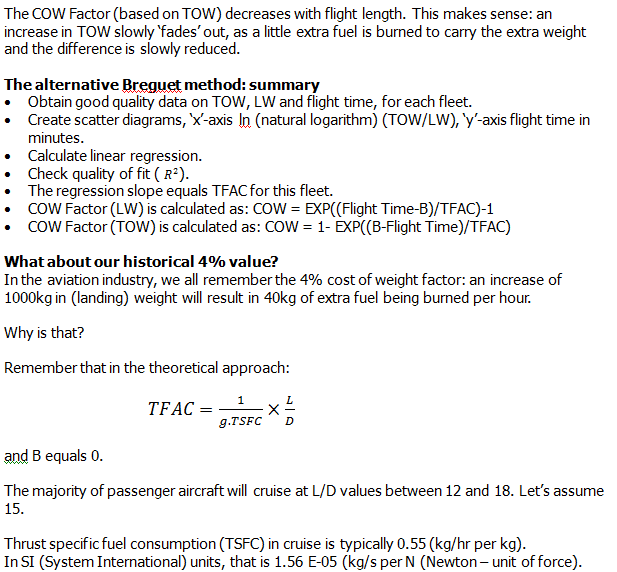
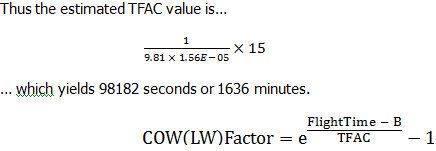
‘Cost of weight (COW) is a primary parameter for determination of the associated cost impact when weight is added to, or removed from, a flight.’ (IATA: Guidance Material for Best Practices for Fuel and Environmental Management, 4th Edition, October 2009). Weight can be fuel, water, aircraft equipment, duty-free goods, payload, etc. We all know the historical value of the cost of weight which is between 2.5 % and 5% per flight hour.
This paper will set out to explain why these values apply to most modern transport airplanes and will suggest a new methodology for calculating cost of Weight, or fuel penalty as it also called.
To determine the cost of weight, airlines need first to calculate weight factors… then…
Total cost of weight = weight change x weight factor x flight hours.
Cost of weight: definition.
IATA defines cost of weight as: ‘the extra fuel burn, as a function of additional weight’.
Fuel burn is quite straightforward; it can be expressed as fuel flow per hour (FF/hour) or as total fuel burn over a given flight.
Weight is also straightforward… at first sight: however, there are different approaches. Instinctively we think of an increase of weight as an increase in take-off weight. Having an additional payload of 10 tonnes will increase the landing weight by (at least) 10 tonnes. To carry the additional payload, extra fuel will be required and that also has weight; so the take-off weight will be increased by more than 10 tonnes.
In order to calculate COW factors correctly, we need to differentiate between two cases: a weight change at take-off, and one at landing.
IATA calculates COW factor based on landing weight. Intuitively, when reading the definition of cost of weight, one will try to determine it by looking at the relationship between different (landing) weights and the corresponding fuel burns (per hour). That is exactly what IATA suggests (‘Guidance Material and Best Practices for Fuel and Environmental Management’, 5th edition, October 2011, p34). The procedure is well explained in the IATA document. Data are collected on landing weight (LW) and fuel burn per hour for each fleet.
They are divided into different time brackets as the cost of weight factor is not constant with flight time. In Figure 1 below, the horizontal axis is landing weight in kg (x) while the vertical axis is average fuel flow per hour in kg (y). A linear trend line is calculated with its equation and quality of fit (R2)
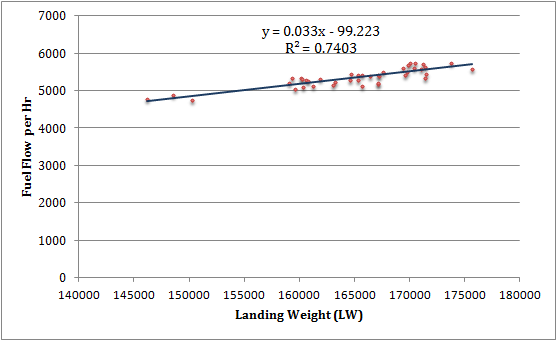
The above graph illustrates the procedure: we have taken all A330 flights in an airline: the graph refers to the bracket containing flights with a duration between 330 and 390 minutes, i.e. 30 minutes either side of 360 minutes or 6 hours. A scatter chart is created, and the slope of the linear regression is the weight factor for this bracket; in this case 3.30% per hour.
The quality of fit, R2 is 74%: a fair value, but statistically not high quality.
When using this method, the airline has to define different time brackets; and each bracket will result in a different weight factor.
The methodology is straightforward. There are, however, some drawbacks:
- Different brackets will result in different weight factors, i.e. a bracket of 60 minutes around 6hrs will most probably yield a different weight factor than would a bracket of 30 minutes around 6hrs. What is your weight factor for a 6hr flight?
- If the airline is scheduling a flight of 8hrs, and no actual data is available for this bracket, no weight factor can be estimated.
- Statistically, the procedure is of medium quality; the quality of fit will typically be around 80%.
- The methodology is based on landing weight and does not allow for calculating the cost of an increased take-off weight. An uplift of 4000 kg of discretionary fuel will have a different effect than a last minute ZFW (zero fuel weight) increase of the same value.
For the above reasons, we decided to try a new approach; starting with some mathematics.
The variation of one parameter in the function of another is a concept described in mathematics, as a ‘derivative’. We were searching for the partial derivative (ð) of the burned fuel in function of take-off weight (TOW) or landing weight (LW).

In order to be able to calculate (1) or (2), we need to find a function, that is derivable, and which expresses trip fuel as a function of TOW or LW.
Breguet Range Formula
Cost of weight is basically a measure of (fuel) efficiency of the aircraft, or the airline. “How good are we at transporting a certain amount of payload over a given distance?” The Breguet range equation provides a relationship between range, aerodynamic efficiency, propulsion efficiency and weights. In a steady state (e.g. in cruise) most of the parameters are constant and the formula can be used for our purpose.

Where…
V = speed
g = acceleration of gravity
TSFC = thrust specific fuel consumption
ln = natural logarithm
L/D = lift over drag ratio
Wi = initial weight
Wf = final weight
NB. Check units and dimensions!
In steady conditions the formula can be written as:
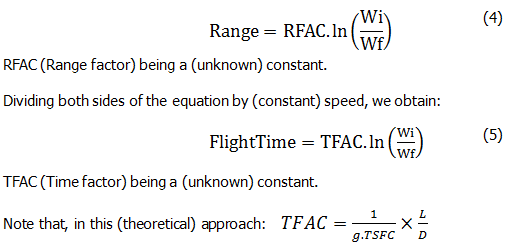
This is the theory.
Extending the scope of this formula to real life flights from departure to destination will induce some noise (greater dispersion), as conditions are not steady. However, statistical analysis and regression will still provide very good results.
Regression on observed flight data
Regression is performed on real data, from take-off till landing. Wi (initial weight) becomes take-off weight, while Wf (final weight) becomes landing weight.
Figure 2 below is a scatter graph of real flight data on A330-200 flights:
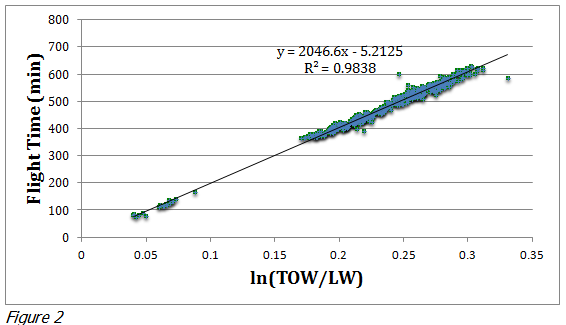
The linear relationship is obvious; the regression is a very good fit, being above 98%.
The Y-intercept does not equal zero, this is the expected noise as the data also cover climb and descent/approach. We can observe that there is a linear relationship between flight time and ln (TOW/LW).
The Breguet theory indicates that the relationship should be:
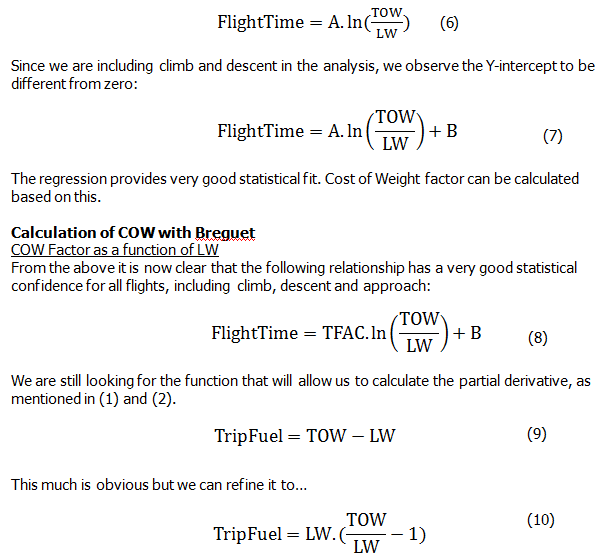


Conclusion
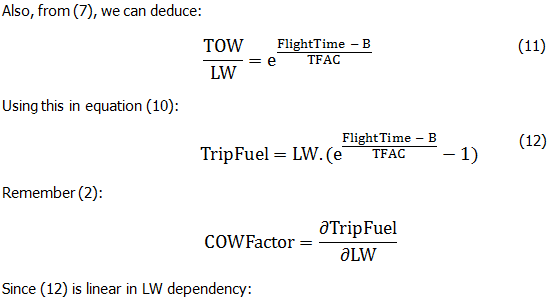
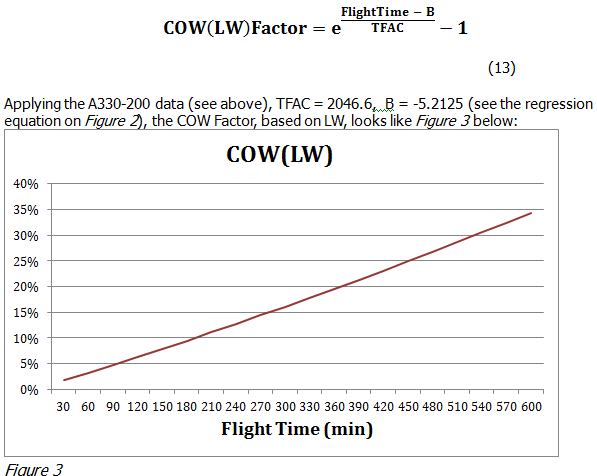
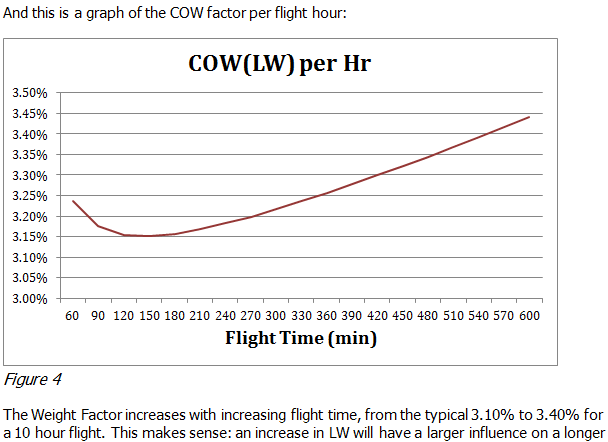
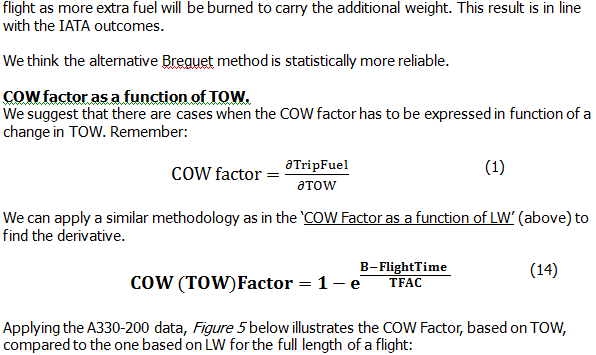
We suggest a new way of calculating COW factors. The argument being that the method is statistically more robust and allows calculating COW factors for all flight times in one go. Also, there is no more need for the multiple regressions required by the IATA method (one for each time bracket).
We believe this method to be more precise and more practical for cost of weight analysis. We also suggest using two different COW factors, one that reflects a change in TOW and one based on a change in LW.
COW (TOW) factor should be used in cases where there is a change of fuel carried: extra fuel uplift, tankering, reduced reserves.
COW (LW) factor should be used for weight changes in ZFW: extra payload, reduced water, reduced catering, aircraft ZFW reduction projects.
The regression on actual data will allow an airline to estimate fuel burn for each combination of distance and weight, for each fleet. As such it can be used to estimate the fuel budget for planned flight schedules, with statistically good precision.
Note
COW factors have always been calculated based on time; they are expressed as a function of flight time. The new approach allows the calculation of COW as a function of distance as well, using the RFAC. From an overall fuel efficiency point of view, this makes more sense: 99% of airlines, and passengers want to travel from point A to point B, they are not interested in being kept aloft for a certain time – the 1% exception being the operators and passengers of sight-seeing flights over the Grand Canyon.
Using distance as a reference incorporates route and Air Traffic Control (ATC) efficiency in the equation: indeed, distance could be great circle distance between departure and destination, planned distance along route, or track miles actually flown. So, great care has to be taken when conclusions are made on the COW, based on the different parameters.
Aviaso, the Zurich based aviation software company, is the first to adopt the new approach in its powerful fuel efficiency tool. The tool is supporting the Ecoflight fuel efficiency program, a joint venture between Pratt & Whitney and Flight Sciences International
Glossary of terms, symbols and acronyms used in this article
COW: Cost of weight
ð: partial derivative of a function with several variables
g: acceleration of gravity
L/D: Lift over Drag ratio
ln: natural logarithm
LW: Landing weight
N: Newton – unit of force
RFAC: Range factor
SI: System International
TFAC: Time factor
TOW: Take-off weight
TSFC: Thrust Specific Fuel Consumption
V: speed
Wi: initial weight
Wf: final weight
Comments (0)
There are currently no comments about this article.

To post a comment, please login or subscribe.