Articles
| Name | Author |
|---|
CASE STUDY: Good weather information when you need it
Author: Martin Gerber – Pilot / Project Manager – Swiss International Air Lines
SubscribeMartin Gerber – Pilot / Project Manager – Swiss International Air Lines shares the experience of leveraging a multi-source 4D pilot weather app for increased awareness, safety and efficiency
This case study is all about weather; something very relatable for the aviation industry and that all readers will have experienced, so will understand its importance, whether you have experienced turbulence as a passenger or as flight crew. I aim to give you an idea of the types of information that we are using in flight planning today and how we can mitigate weather related events in the air. Then we will look at the opportunities and capabilities that a modern weather application has to offer.
WEATHER PLANNING TODAY
Let’s start by giving you an idea of the bare legal minimum that pilots have to use when planning a flight, before getting airborne (Figure 1).
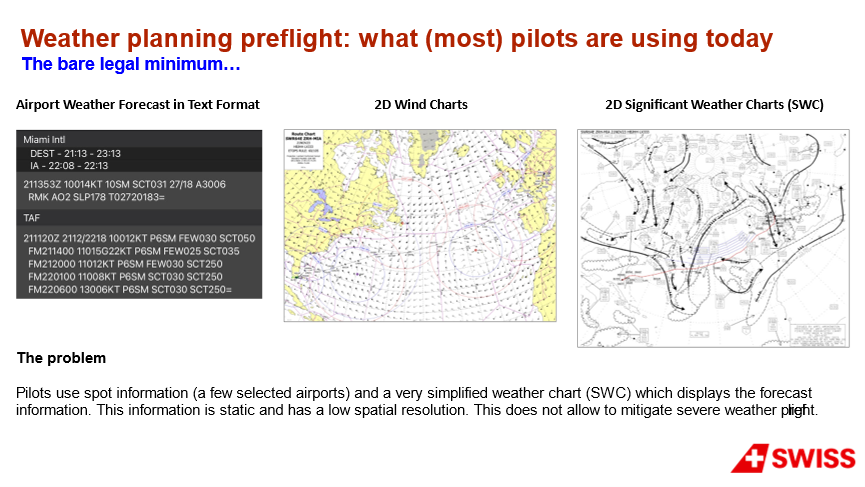
Figure 1
The regulator specifies a minimum amount of weather information that flight planners, dispatch and, of course, pilots have to consider before take-off. One thing that we have to include is the weather at the departure airport as well as at the destination airport and, depending on the length of flight, alternate airports.
This weather information is provided in a very simplified text format, rather like a code so not very intuitive to read. Pilots learn the terminology used but even after many years, it’s still information in text form; hard to relate to something visually in three dimensions. Then there is a Wind Map which indicates the directions from which the winds are blowing at the flight’s cruising level. Finally, there is a Significant Weather Chart (SWC) a two-dimensional depiction of the weather situation showing areas of convection, thunder storms and areas of turbulence. Updated about every six hours, this is quite a static view of the weather. We’ll look in more detail at how useful this kind of information is today.
In figure 2, we’re using a real flight, a Swiss International Air Lines flight returning to Zurich, to illustrate the point.
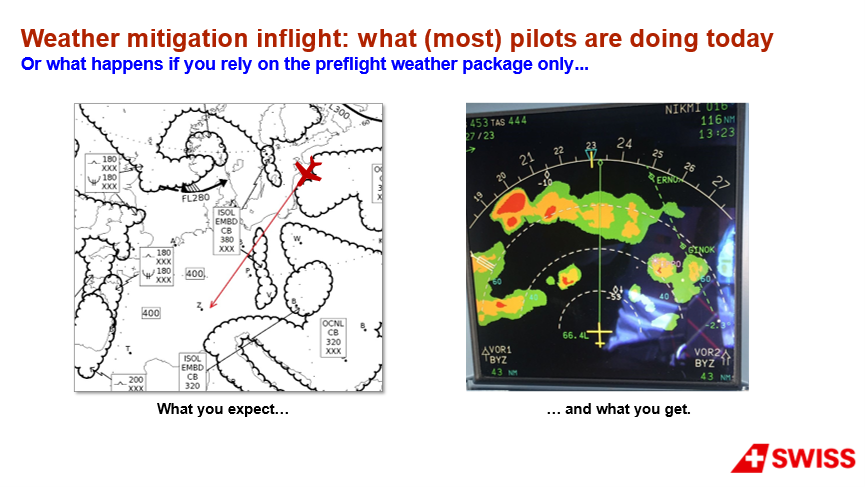
Figure 2
On the left side, you can see the planning document weather chart that was used before the flight. Once in the air, the primary source of information for weather mitigation is the weather radar, the red spots indicating areas of thunderstorms in convective areas. Then the pilot has to decide whether to go right or left, what is the better way to fly around this weather because no-one would intentionally fly through a thunderstorm. It’s a fifty-fifty choice and, in in this case, when the pilot got closer to the weather, he decided to turn four degrees left but, in the end, found himself facing a thunderstorm. The fifty-fifty likelihood turned out to not be in the pilot’s favor.
Bearing all this in mind, we did some research in the archives and found something quite surprising; that 70 years ago, there was a weather briefing package used by pilots in 1953 that looked like the illustration in figure 3.
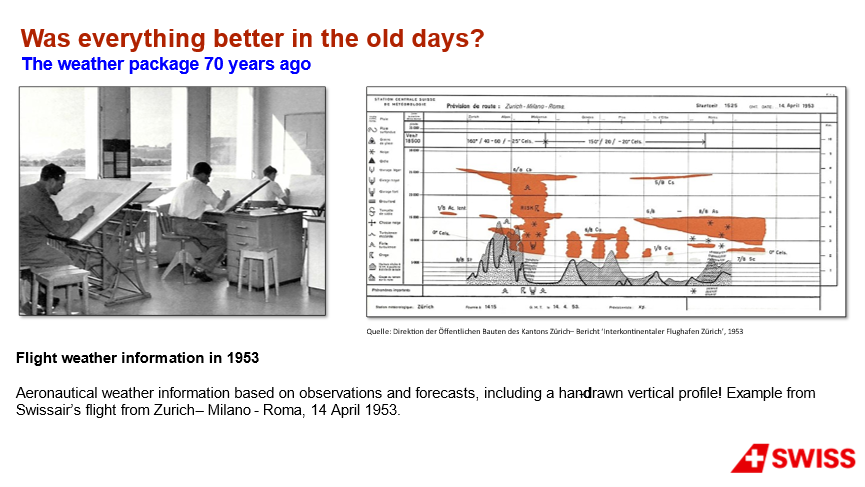
Figure 3
What can be seen is a Swissair flight from Zurich to Rome and there were Meteorologists sitting in an office drawing very accurate, two-dimensional vertical cross sections of weather along the flightpath. You can see thunderstorms indicated and the types of clouds that would be encountered. There was a lot of information available 70 years ago and more than we have today. So, maybe there is something we can learn from those older people and processes. It led Swiss to think about a weather app and that led us to implement a weather application, SITA eWAS (electronic Weather Awareness System) from SITA.
A MODERN AND INTUITIVE WEATHER APP
SITA eWAS is a tool that displays observation, predictions and a vertical profile from a range of weather sources that the customer can select (figure 4); rather like what we had 70 years ago.
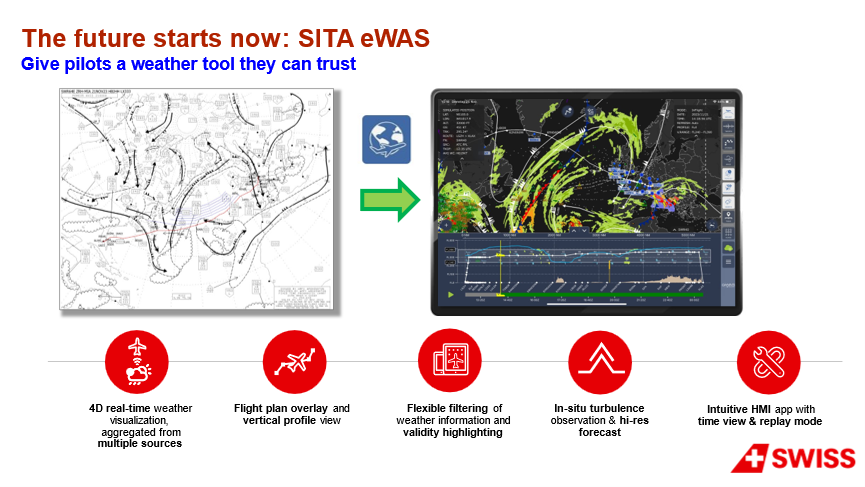
Figure 4
One of the great strengths of SITA eWAS is that users can can select how the products they want are displayed. In this example, from Swiss, we selected 22 different products in addition to that bare legal minimum that the regulators require. We can also categorize three categories of weather information. One is observation, such as the actual precipitation or everything you can observe for a satellite and measurements from an aircraft, real time data and pilots’ reports. Then we have forecasts; readers will be familiar with long-range predictions that can look ahead 12 hours, 24 hours, 36 hours or more; the output from a numerical weather model and what the models are predicting into the future which might be convection, precipitation, turbulence or icing. Then there is something in between which is called Nowcast, a combination of observation, perhaps a satellite observation, and a short-term prediction for the next two hours. Altogether, we now have quite a comprehensive weather package.
You might think that this is just a fancy gadget for pilots and, of course, pilots do like gadgets. However, there is more behind this. In 2018, the European Aviation Safety Agency (EASA) issued ‘The Weather Information to Pilots Strategy Paper’ with nine recommendations. Before we started implementing SITA eWAS, we took this Strategy Paper as a guideline to check off all of the targets that we wanted to achieve with the app.
Just a few of these were:
• EASA suggests that we strengthen flight crew training on mitigating weather-related hazards and threats.
• It is also suggested that weather information is displayed in an intuitive way using, perhaps, colors, and EASA strongly recommends that the weather is updated once the flight is in the air. On long-haul flights the weather will change but, if there’s no internet on board, you will end up at the destination still with the weather information that you had before take-off. Especially when it comes to observation data, there is a huge benefit to be gained from using in-flight connectivity. Unfortunately, it’s not uncommon that sometimes passengers have access to the Wi-Fi on board while the pilots don’t and then you can find that passengers know exactly what thunderstorm is ahead of you yet the flight crew are unaware. There is a lot of progress underway and it does take time to get everything certified on the flight deck but there is huge benefit to be gained from connectivity on-board.
• EASA recommends to use high-resolution 4-dimensial forecast models and we’ll look at a few examples of that further on, where tier 2, non-certified products can be used.
• EASA also suggest enhancing the capabilities of the aircraft to use it as a ‘weather balloon’, a sensor for weather information, and that that information is broadcasted.
• And last but not least, weather radar remains the primary source of weather information once the flight is airborne and there can never be a situation where the weather app is telling you one thing while the radar on-board tells you something different.
REAL-LIFE USE CASES USING eWAS
In figure 5.1, there are a few real-life use cases using eWAS in an airline context.
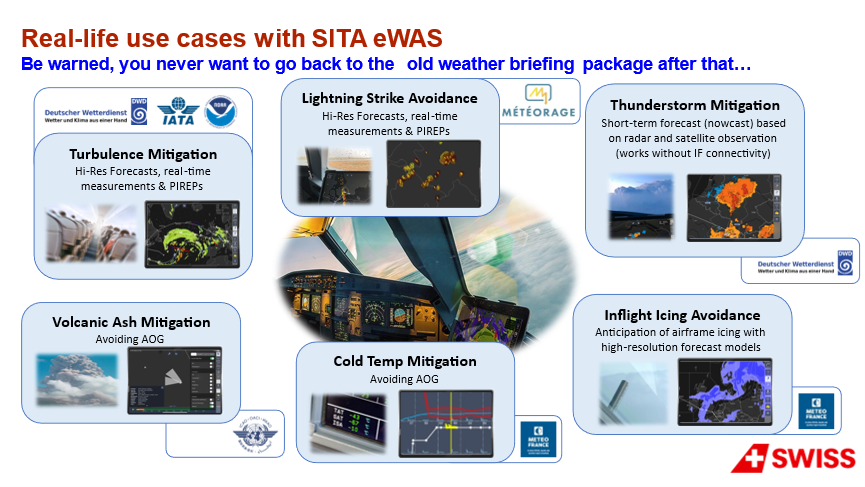
Figure 5.1
One use case is Turbulence Mitigation (figure 5.2). Turbulence is the leading cause of non-fatal accidents in aviation, mainly where passengers are not wearing their seatbelt or Cabin Crew doing service are taken by surprise with turbulence and, beyond the physical danger, there is also a reputational issue; no airline likes to see pictures on social media where everything is flying around in the cabin.
Lightning strike is another use case. Every lightning strike means an inspection of the aircraft which often ends up in grounding the aircraft for a few hours when it has to be taken out of service. Lightning strikes don’t occur in the clouds otherwise it would be simple to say, just fly around the clouds. But there are often lightning strikes in clear visual conditions. However, when you have a weather app, you can see where there is lightning and you can decide on your departure with maybe a few more miles to extend your departure or an early turn and this is definitely something that can be achieved using SITA eWAS.
There are a few examples of thunderstorm mitigation. And then there is in-flight icing, depending on the type of aircraft; for smaller aircraft flying at lower levels, icing is more of a hazard than for larger aircraft flying higher but still icing has an impact, perhaps on the fuel policy and whether you want to do tankering for the return flight; cool fuel in the wings can lead to icing on the wing structure and that has to be de-iced. There is a lot to consider in the decision making before the flight. Another consideration is cold temperature mitigation; there is a temperature limit for most aircraft, for example, on an Airbus A320 it’s minus 70° Celsius. It’s not uncommon for these temperatures to be exceeded in winter times and, if you’re going by the book, that will require maintenance inspections so that every exceedance of cold temperature leads to an AOG (Aircraft on Ground) for four to five hours before it can be released into service again. Volcanic ash is another very expensive use case. We experienced that at Swiss with a short-term Volcanic Ash Advisory which had not reached the flight crew because they were already outbound. They flew through the area covered by the Advisory and that was very expensive for the airline which had to do inspections and repairs on the engines.
Here are two specific use cases. The first use case is about turbulence mitigation and the second about thunderstorm avoidance.
Turbulence mitigation
Turbulence mitigation can simply involve two pilots sitting in the cockpit drinking coffee and once it becomes too shaky to drink their coffee, they contact air traffic control to report the turbulence and request to descend or climb (figure 6).
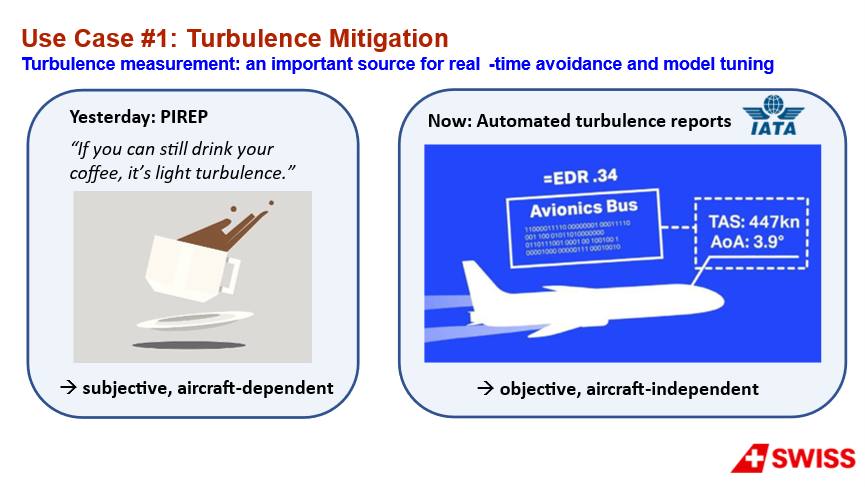
Figure 6
However, there will often be a lot of traffic in the air and everyone is making that same request. Eventually, some flight levels become congested with aircraft that are trying to avoid turbulence. In short, it’s more of a reactive strategy if you wait for turbulence and only then do something about it. But three or four years ago, a new approach became available with which aircraft can report an account of turbulence automatically. It’s an algorithm that was developed by the National Centre for Atmospheric Research (NCAR) in the USA and has now found widespread application, first on Boeing and now on Airbus aircraft. With this, aircraft can use their own angle of attack sensors to measure, to an objective degree, turbulent air. In this example, I’ll explain the benefits of objectively measured turbulence data.
But before that I’ll say, when scientists or meteorologists start fine tuning their forecast models, they need data, they need something against which to compare the accuracy of the forecast and that’s where these objective measurements become extremely valuable.
Nowadays there will be about one million reports a week so that scientists are able to tune their reports using objective data. In this example, there is a significant weather chart (figure 7.1) on which the only difference is the color where there are areas of convection and turbulence and I’ve highlighted the area of predicted turbulence to make it a little more visible.
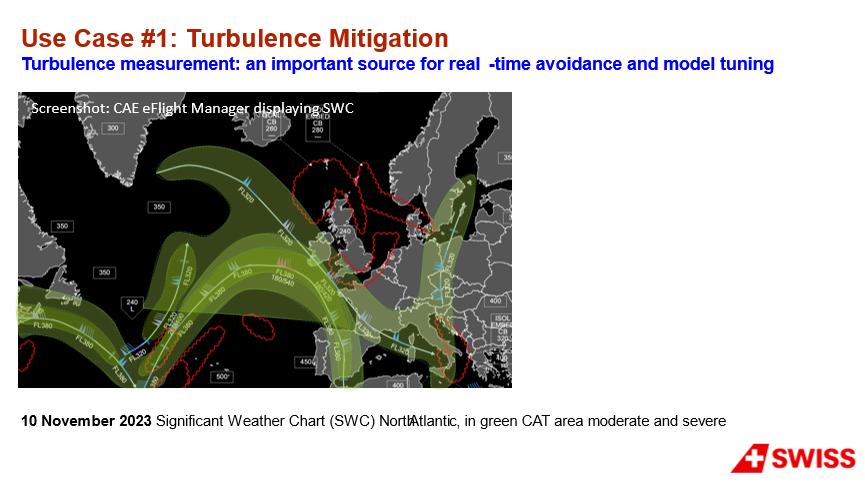
Figure 7.1
Between Europe on the East side of the figure and the US on the West side, you can see that 50% 0f the North Atlantic is predicted to be rough air.
In figure 7.2 we have a screenshot from SITA eWAS showing the last four hours of measured turbulence from aircraft in the air.
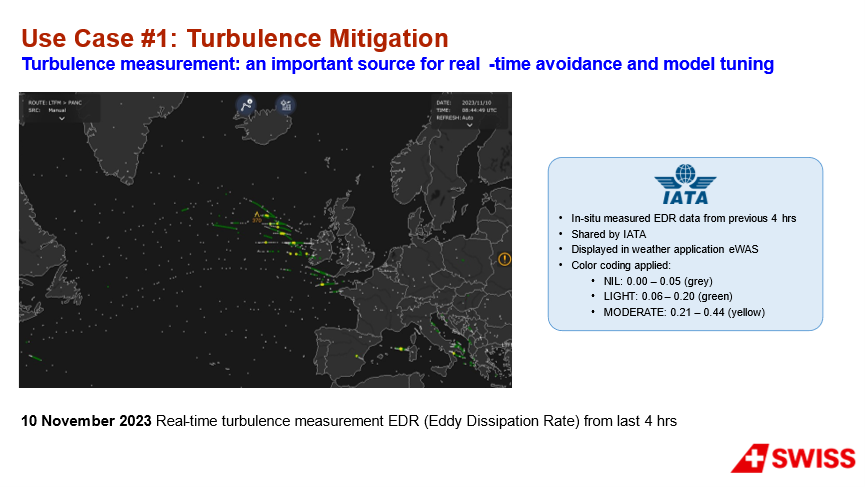
Figure 7.2
Every dot here is a measurement: a gray dot is clean air; green is light turbulence and yellow is moderate turbulence. There is some activity shown over the Atlantic and a little bit on the Adriatic between Italy and the South part of Albania. Those are the areas where there is rough air, and when we compare that with what has been predicted in the significant weather chart, figure 7.1, it is only around 20 percent of the predicted area where there is actually rough air. When we plan with the Significant Weather Chart and we go to the cabin crew briefing, they will ask how the flight is going to be. We can say that maybe there is something, maybe not, we cannot tell with any accuracy. But now, with measurable data, we can properly advice the cabin crew about what is going to happen and when it might be sensible to stop service because there is a high risk of turbulence related incidents.
I mentioned the predictions, the numerical models that are an add-on to the measurements. Measurements are for the past four hours but when we have a twelve-hour flight, we want to know what will be happening in the next six hours and that’s where the models become very useful and, as you can see, there is a high level of accuracy between the forecast and the measurements these days. It represents a whole new step from what we used to have during the past 30 years (figures 7.3 to 7.6).
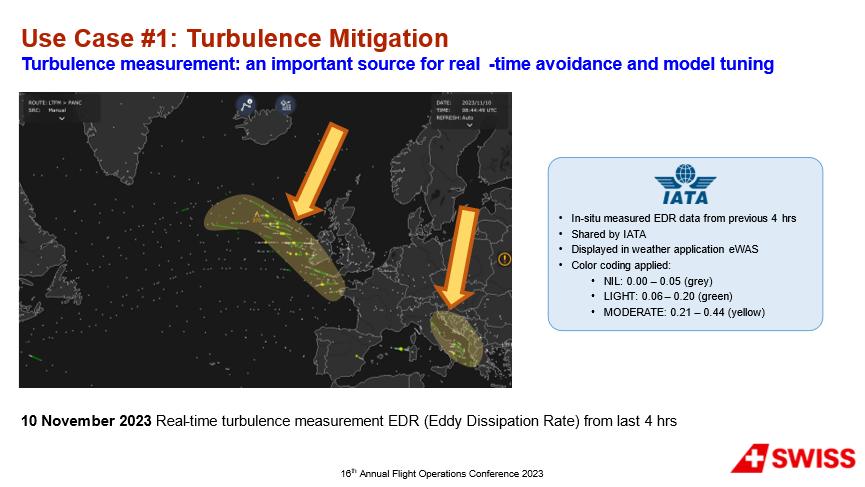
Figure 7.3
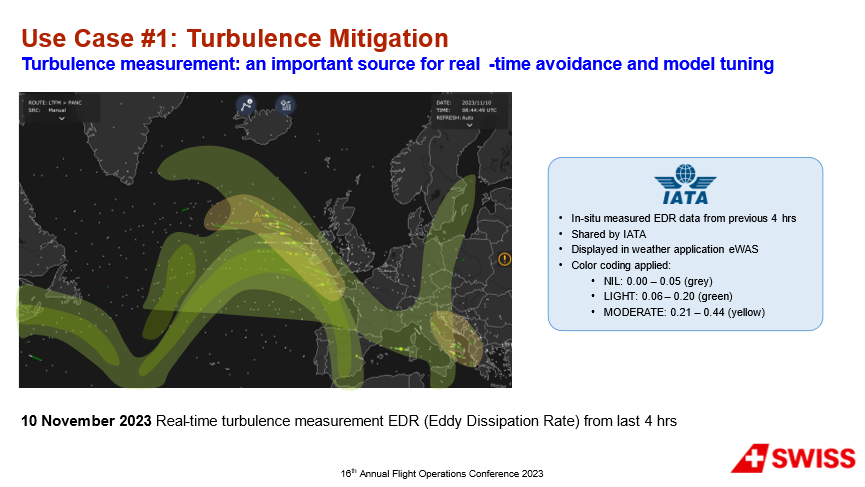
Figure 7.4
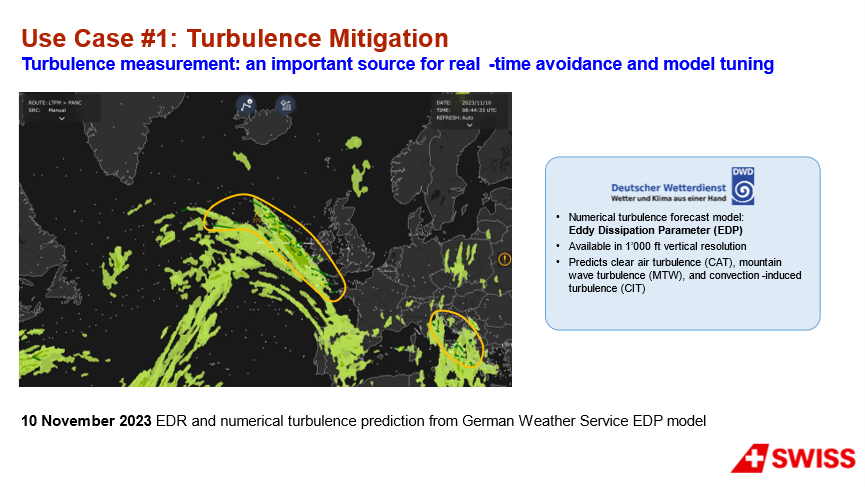
Figure 7.5
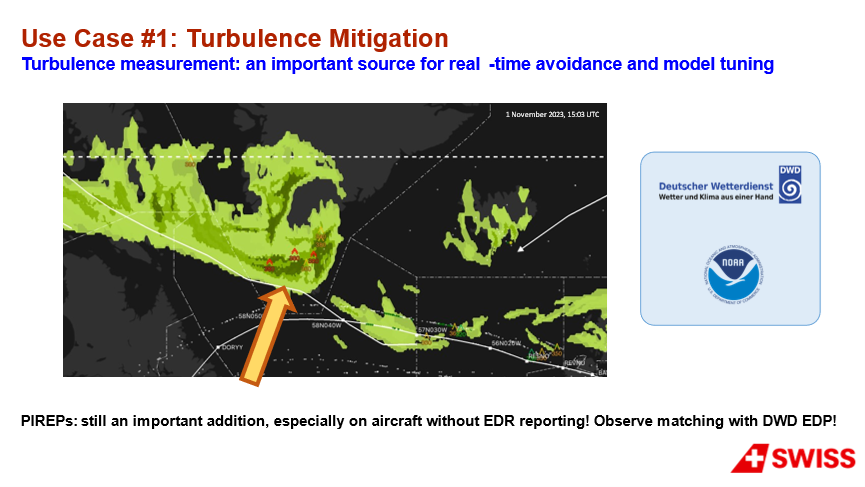
Figure 7.6
There are aircraft that don’t have the capability to automatically report turbulence and, in this example, we see the forecast from the very accurate German Weather Service model with the PIREPS subjective reports. It offers a stunning accuracy that nowadays we have when we use this high resolution 4-dimensional (4D) forecast models.
The last example is a flight from 2018 with an aircraft scheduled from Miami to Zurich (figure 8).
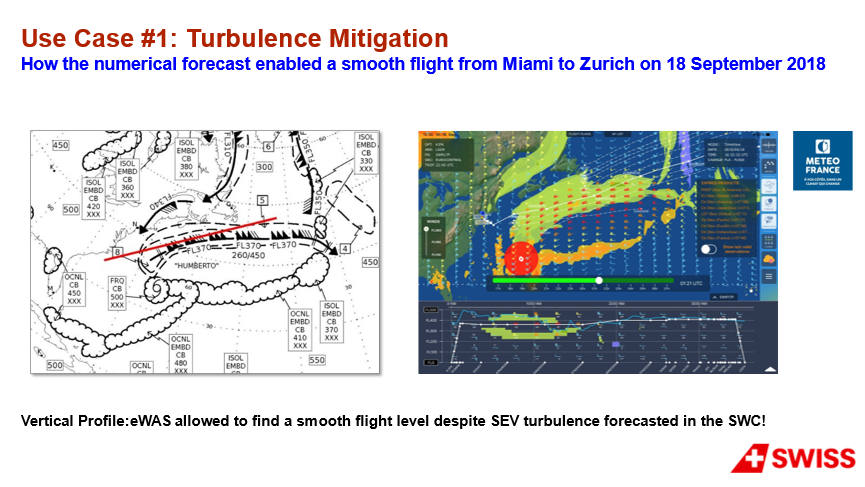
Figure 8
They had two options but neither option was comfortable because there was a hurricane over the Atlantic. They could choose to either go South and almost through the Hurricane or they could stay North but there was an area of turbulence forecasted along their route during the four-hour flight time. However, they had SITA eWAS with them and, on the vertical profile, they could see how, surprisingly, there was a flight level that was predicting smooth air. The reason for that was that in the Jetstream there is usually a very small area of smooth air. They changed the flight plan to a lower altitude and the pilot on the flight reported that they did not encounter any rough air during the entire flight. Had they just relied on the significant weather chart, it would have been quite a lot different.
Thunderstorm mitigation
The second use case that I’d like to share with you is a flight from June 2023 from Zurich to Copenhagen. Again, we start with the significant weather chart (figure 9.1).
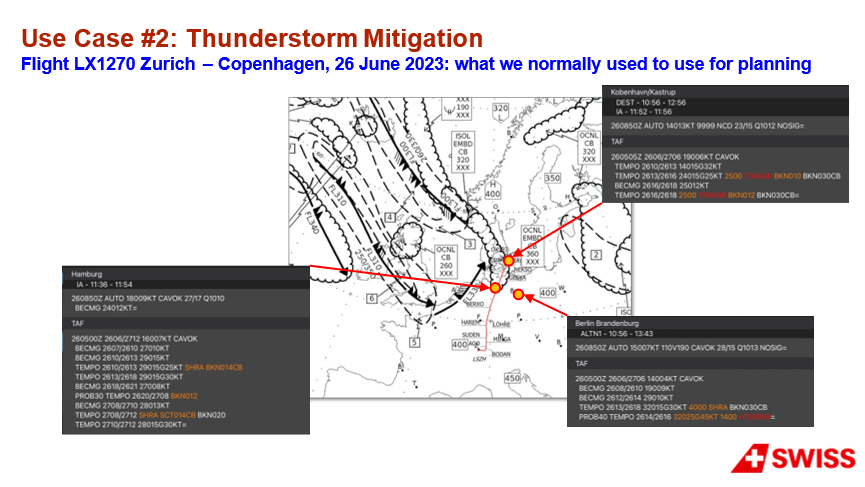
Figure 9.1
We had to look at the chart because the regulator expects it. There is a weather forecast for all the different airports and, on that day, we had the Copenhagen destination with a prediction of thunderstorms over a time frame of about four hours. There were some clouds marked but with no indication whether they were static or moving and, if moving, by how much. There was also thunderstorm activity around Hamburg and Berlin for about two hours after the forecast had been generated. The weather was within operating limits and so the flight was cleared to depart. However, about 20 minutes after departure, it was recognized that there was some weather ahead which was also on the aircraft’s weather radar. So, again, the pilots were faced with the question whether to go left or right with either way having a fifty-fifty chance of encountering weather. The decision was taken to go right, about 30 NM off track to avoid the clusters along the next 120 miles. Unfortunately, as the flight approached Copenhagen, the squall line grew ever larger, the sky darkened and the echoes on the radar became more pronounced. It was about 80 miles to the destination but, as well as the significant weather chart, there was also SITA eWAS available which offered the following idea about what would happen on this flight (figure 9.2).
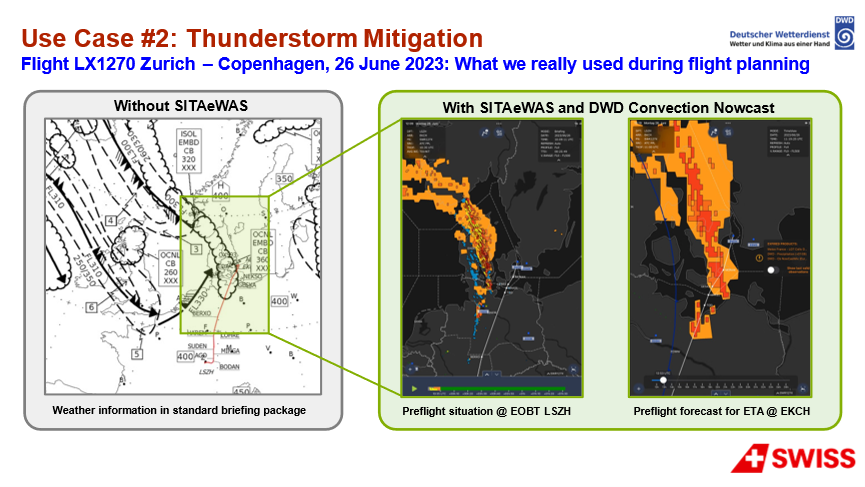
Figure 9.2
The actual situation, when the weather briefing was conducted in Zurich, looked like the picture in the middle so it could be seen that there was precipitation, there were lightning strikes, convective activity and a massive squall line about two hours from Copenhagen. The Nowcast models allow users to look up to two hours into the future and receive a very accurate prediction of where these thunderstorms will move to. Moving the slider to the right, to the time of arrival, it could be seen that that there was a reasonable chance of getting to the destination before the airport was closed (figure 9.3).
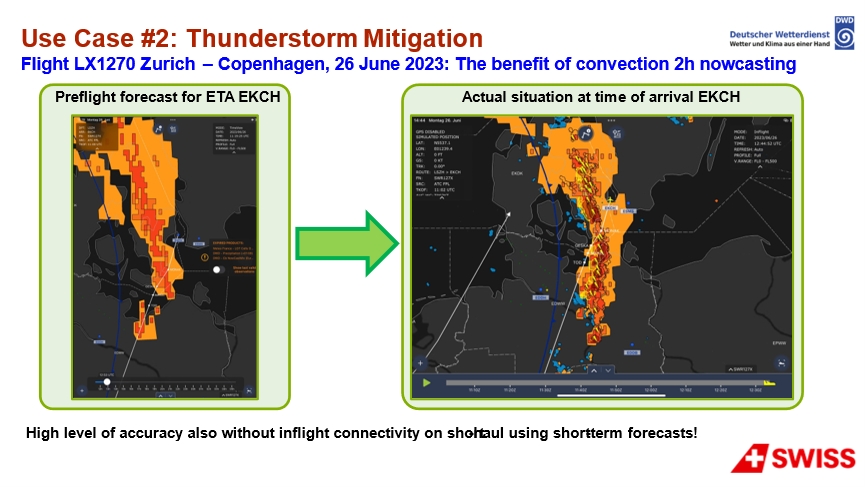
Figure 9.3
What happened in reality was that the image on the left was the time of arrival situation that was expected before departure while the image on the right was the actual situation at the time of arrival. As you can see, the actual situation encountered was a pretty good match with the forecast. The airport closed just after the flight arrived so the prediction was impressive. This example really shows what additional value can be gained from a weather app.
SITA eWAS isn’t complicated to use; it’s very intuitive. You simply move the time slider two hours into the future, make an assessment and you have a strategy for time in the air because you already know, and want to keep ahead of, the weather. Also, with plan B should the airport close, there will be a route through good weather to the alternate.
REASONS WHY SWISS CHOSE SITA eWAS
We have been working together for quite a few years now and, in all of these years, when we talk to the engineers and the developers at SITA, we felt that they have a lot of passion for what they do. What was important for us about a weather map is that it is agnostic to the type of weather product being displayed. That’s because, in the same way that there is competition between weather apps there is competition between weather products. There are different weather agencies, the German Weather Service, UK Met Office or Météo-France, to name a few, and they all want to develop the best forecast. As an airline, we want to be in a position where if, in the future, there is a company coming up with something new, perhaps using Machine Learning, or with a hit rate of 99 percent, we want to be able to change to a different weather provider. So, we talked to SITA, asked if they could integrate the product from the German Weather Service and, within half a year, it was in. We felt they had listened and that our requirements were taken of.
Something else is that, once the pilots are in the air, there are still people on the ground, monitoring the flight and that is called SITA Mission Watch route support, an application that mirrors the weather on the ground, SITA eWAS for dispatchers. That means that when the pilot talks to the people on the ground when making a decision on diversion, there is a shared mental model of the situation. When it comes to observation data, that’s straightforward because what is observed from a satellite is most likely there but when it comes to forecasts, it’s quite important that you have something similar or identical to look at.
The app also has a very intuitive user interface which meant that, for Swiss, there was no real need to train the pilots albeit that the digital natives were often faster to discover all of the hidden features in the app. And, to conclude, one of the pilots stated that when he moved from the black & white weather chart to a 4D aviation weather application, it was like going from the old analogue cockpit with gauges and dials, to a glass cockpit.
Comments (0)
There are currently no comments about this article.
To post a comment, please login or subscribe.