Articles
| Name | Author | |
|---|---|---|
| Case Study: Power Play and the consequences of equipment upgrades and overhauls | Karl Jones, Head of Avionics and Technology Development, Marshall Aerospace Ltd | View article |
| White Paper: A Discussion on Project Management | Wes Parfitt, CEO and Founder, EnvelopeAPM Inc. | View article |
| White Paper: An Inconvenient Truth: CMS.. | Thanos Kaponeridis, President and CEO, AeroSoft Systems | View article |
| White Paper: Life is Dynamic: Business must operate dynamically too | Michael Wm. Denis, Principal, ICF SH&E | View article |
| Case Study: Challenges in capturing man-hours and materials consumed in airframe checks | Dr. Roberto M. Asuncion, VP-IT, Lufthansa Technik Philippines | View article |
Case Study: Power Play and the consequences of equipment upgrades and overhauls
Author: Karl Jones, Head of Avionics and Technology Development, Marshall Aerospace Ltd
SubscribePower Play and the consequences of equipment upgrades and overhauls
Karl Jones, Head of Avionics and Technology Development at Marshall Aerospace Ltd outlines the in-house development of SERIES, an Electrical Load Analysis program that models an aircraft’s distributed power architecture and loading under varying scenarios
The phrase ‘necessity is the mother of invention’ really does encapsulate what engineering is all about, and every now and then we create, either by accident or intentionally, something that will be of great benefit to others. This case study recounts how and why we developed a PC-based tool (for in-house use) for modelling electrical loading on an aircraft, and how doing so laid the foundations for SERIES; a commercial software product and associated support services.
Requiring Proof
Within our industry, upgrading aircraft avionics – typically to keep pace with industry regulations – is of course a common practice for both commercial and military aerospace platforms. Also, making modifications to accommodate changes of role or to meet other operator demands is a regular occurrence too. However, modifications and/or upgrades cannot be made without considering the ramifications of doing so, and this includes the impact on the aircraft’s electrical system.
In many of the projects Marshall Aerospace undertakes we are aiming to add equipment (i.e. new electrical loads) to aircraft without necessarily upgrading their generators or power bus bars (which tend to be original-fit). However, an aircraft’s electrical system is a relatively dynamic entity; designed to accommodate different modes of operation (e.g. flight phases) and to provide varying degrees of redundancy in the event of losing a generator or key power distribution point.
Accordingly, there are many permutations to consider when predicting the effect on the electrical generation and distribution system of adding new loads. Moreover, the aviation authorities require proof that proposed changes to an aircraft will not affect safety – under any mode of operation and/or envisaged fault condition.
The normal method of providing that proof is through conducting an Electrical Load Analysis (ELA) which is a steady-state, worse case view of all the AC and DC loads summed and compared to the ability of the aircraft’s generation system to provide power. The necessity to assess the generation system’s ability to cope in abnormal conditions has long been a desire in our industry. Rarely though does this assessment get any further than particular cases in the failure modes and effects analysis (FMEA) – which is normally a text based document that references some of the ELA’s key findings.
More frequently the ELA is in the form of and displayed in a spreadsheet, as it is better suited for calculations. Indeed, before developing our own software we too handcrafted ELAs using spreadsheets and therefore speak from experience when listing the following difficulties:
- Even before tackling sums it was always necessary to apply a variety of rules to validate the legitimacy of some of the figures that would be entered, for example sensible power factors (typically between 0.9 and 1.0) and duty cycles (which cannot be greater than 100%).
- The spreadsheets were often large and cumbersome, mainly because we were trying to represent a multidimensional problem (i.e. introducing potential failure modes over different aircraft configurations operating in a number of modes) in a 2-dimensional format. In other words, the permutations are such that you can’t help but end up with separate columns (or even tabs) for the different scenarios with cells across tab pages linked to one another;
- The size and complexity of the spreadsheets increases the risk of errors propagating throughout – adding to the amount of time required to verify the validity of the conclusion (even with rules in place).
- Illustrating spare capacity (or ‘power headroom’), whilst not required by all aviation authorities, is always popular with the operators, as it indicates how accommodating the current generators and bus bars might be to other modifications. Again though, the task requires extensive number crunching in spreadsheets.
In addition, commercial spreadsheet tools are aimed at a very diverse audience. The software companies want their products to be useful for book keeping, maintaining tables of contacts, presenting data as pie charts, creating histograms for presentations and a host of other tasks. Accordingly, as tends to be the case with any general purpose business focused application, we only used about 10% of the spreadsheet tool’s functionality – and what we were using, we had to work hard.
Surprisingly, a similar (if not worse) situation would have existed had we attempted to employ a Computer Aided Design (CAD) or Electronic Design Automation (EDA) tool for our purposes. There are several CAD/EDA tools available for modelling electrical/electronic circuits, cable harnesses and systems, but these are focused purely on design for manufacture (DFM). They are not optimised for conducting ‘what if’ scenarios and cannot store or represent an entire aircraft’s electrical configuration.
The Catalyst
A new aircraft will normally have a paper air publication, depicting the ‘as delivered’ configuration of the electrical generation system and equipment loads. This is typically referred to as the Original ELA.
Incremental modifications are usually approved on the basis that, after careful examination of the Original ELA, the theoretical safety margin between existing loads plus proposed additions and the generating capacity is acceptable.
Demonstrating the theoretical safety margins requires conducting several ELA scenarios, and it is fair to say that the need for a dedicated software tool for ELA has been recognised within Marshall Aerospace for several decades. However, whilst having the capabilities and recognised approvals of an aircraft OEM we have a very modest budget set aside for R&D compared to the OEMs.
It was during discussions with the Royal Australian Air Force (RAAF), a few years ago, that the subject of modelling aircraft power architectures arose, and the operator recognised that the continued airworthiness of its C-130 airlift fleet would be demonstrably more robust with a more efficient means of doing ELA.
As Marshall Aerospace has operational support and maintenance contracts with the majority of progressive C-130 operators around the world we therefore helped the RAAF with an update to its paper ELA.At that time it became apparent that improving the ELA method for the reasons cited above, would be beneficial and offer all operators more confidence in the accuracy of the ELA. Hence development on a software-based ELA tool began, and we were soon referring to it as SERIES (standing for System Electrical Rating Integration Evaluation Software).
We started our development programme by modelling the connectivity that exists in an aircraft’s electrical distribution system, using a number of icons to represent certain ‘bus elements;’ such as generators, transformer rectifier units (TRUs, for converting AC to DC), inverters (for converting DC to AC), transformers (AC to AC) and batteries (DC). We colour coded the bus elements to indicate their output type, yellow for AC and green for DC, and used arrows to provide an indication of upstream or downstream connectivity logic. Figure 1 shows the results of our efforts.
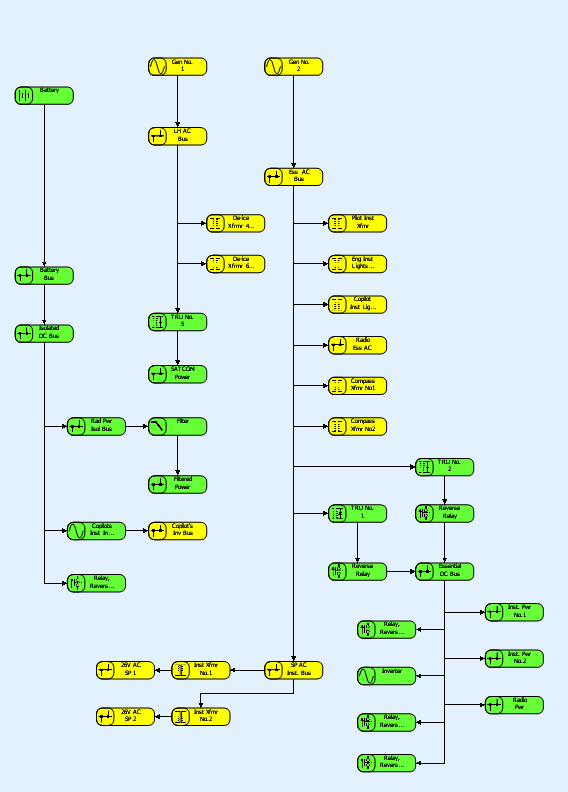
Figure 1: A considerably clearer picture than can be achieved using any spreadsheet, the user interface we created looks like the distributed power architecture it is meant to represent. Zooming in makes clearer the name of each bus item plus appends the loading (in Amps for DC elements and kVA for AC). At this level though we are more interested in the architecture/connectivity.
With the electrical system represented we then set about devising a way of loading it, and came up with a means whereby components (by which I mean anything from a light bulb to a galley oven) can be dragged from a library and dropped onto the bus elements; to load them.
It was at this stage that we started adding the kind of ‘intelligence’ that was and is so painstaking to handcraft in a spreadsheet. For example, single supply components placed on a suitable bus element will automatically be accepted; and contribute to bus loading at that point. However, if there is a mismatch between a component’s (required) power type and the bus element’s, placement will not be permitted.
In addition, if a component requires connection to more than one power type, this will be indicated to the user until it is fully connected. Moreover, when connecting a single phase device to a three phase supply we have made it so that the user must select one of the phases.
To support our intended ‘what-if’ scenarios we had to make it easy to see the electrical loading at the bus elements, and accommodated this by allowing the user to zoom in and see the power consumption (in Amps for DC elements and KVA for AC elements, giving a breakdown for each phase if applicable). We also designed the user interface so that left clicking on a bus element will list, in a panel, all the components connected to it. And right clicking any of those components allows its properties and assignments (such as phase allocation) to be changed.
Further building on the ease of use approach, dragging a component out of a bus element list disconnects it from the bus and makes it available for use on a different bus; and in the case of components still connected to another bus element, it will be indicated on the main screen that there are missing connections.
Clearly, for our ELA tool to be as representative as possible of real life loading much would hinge on the level of detail we could assign to the components. We particularly wanted to reflect that some components have multiple modes of operation (each potentially equating to a different load). For example, a radio that, in receive mode, has lower power consumption than when transmitting.
Worthy of note is SERIES’ support for multiple power supplies. Figure 2 shows the details of an Inertial Navigation Systems (INS) that can connect to three power sources (28V DC, 26V AC and 115V AC) and that the first and third are required. In its default mode the INS draws 32VA when connected to a 115V, 400Hz AC supply; and its inductance leads to a power factor correction of 92%. Not shown, but when connected to its 28V DC supply, in default mode the INS represents a load of 0.9W, and the power factor correction is 1 (which always the case for DC).
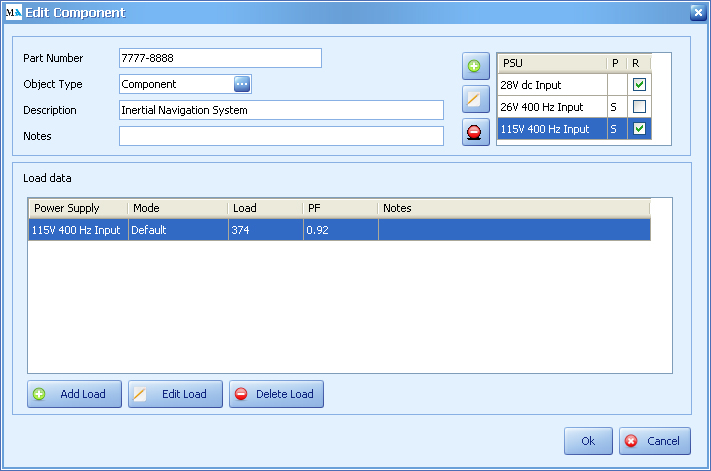
Figure 2: Attention to detail. This is the user interface we devised for detailing how a component will load its respective power supplies (and there can be more than one). Not shown, but different modes of operation can be represented. A radio for example, draws more current transmitting than when receiving.
With the ability to add and remove components (with multiple modes of operation where applicable) we next addressed the issue of failure modes, and decided that failing a bus object should be as easy as Right Click, Fail.
Figure 3 shows the failing of Gen No. 2 and TRU No.2. Note: you might want to compare Figure 3 against Figure 1 to see how power is re-routed. Importantly, this re-routing (on screen) is not because of intelligence within the ELA software, rather it is reflecting the intelligence designed into the aircraft’s systems. SERIES is a modelling not a design tool.
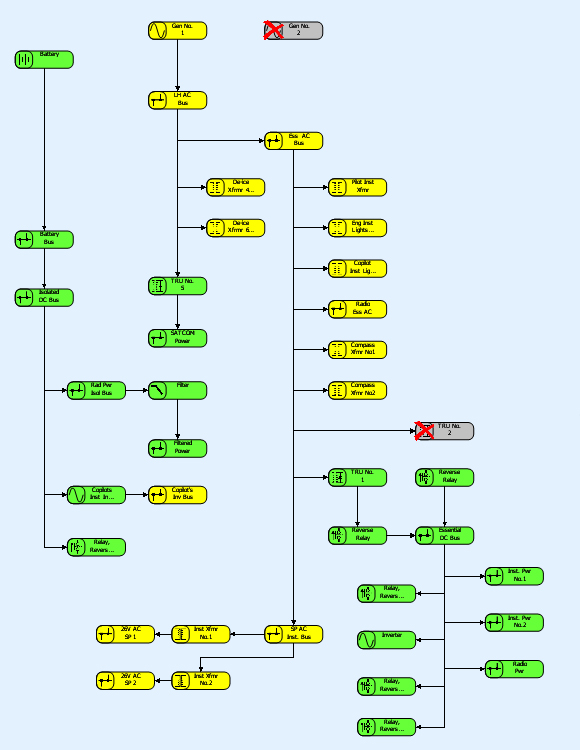
Figure 3: Above, failed bus elements are indicated by red crosses; and the links between them and their immediate children have broken. Also, where the (real) system is able re-route power this is reflected by new connections. For example, no longer able to take power from Gen No. 2 (as per Figure 1), the Essential Aircraft Bus (ESS AC Bus) now takes its power from the LH AC Bus (adding to both its loading and that of Gen No 1).
Flight Phases & Loading
Armed now with the ability to add new components (i.e. as part of investigating the safety of a proposed modification or upgrade) and explore the effects of failed bus elements we then needed a quick and easy way of visualising short-, medium- and long-term loading.
The military standard MIL-E-7016F defines what constitutes short-, medium- and long-term (loading) durations and states that each depends on a number of factors, including whether the component is AC or DC, and for how long it is operational during certain flight phases. Indeed, it is this complexity that makes ‘flattening’ (in a spreadsheet) how an aircraft’s electrical system really operates so difficult.
A snapshot of short-, medium- and long-term loading on an LH AC Bus for different flight phases is shown in Figure 4. Also, note the Analysis Type option. As shown it is set to Realistic but it can be switched to Worst Case, which assumes all components are in their highest current drawing modes; something which in reality should not happen if the aircraft’s avionics is doing its job and is scheduling systems correctly. But then again, this wouldn’t be a truly useful ‘what-if’ analysis/modelling tool if we were to assume certain things could never happen.
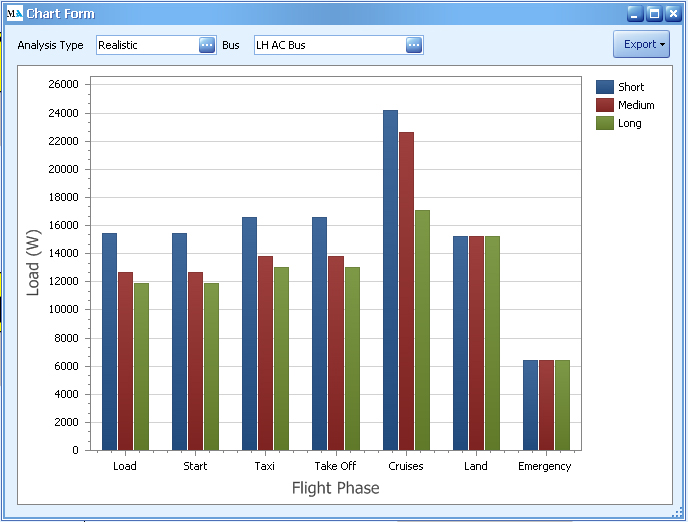
Figure 4: Above, a snapshot of Short-, Medium- and Long-term loading on an LH AC Bus, for different flight phases. It is our intention that a future version of the software will overlay the graphs with limit bars, or use some other means of showing that loads have been exceeded.
Whilst colourful and useful, the image is of course a summary of the facts and figures that must be submitted, in accordance with MIL-E-7016F, to the aviation authorities when attempting to demonstrate that (on paper) a modification or upgrade can be made safely. Figure 5 shows some of the data – presented as required by MIL-E-7016F – that can be exported into a report.
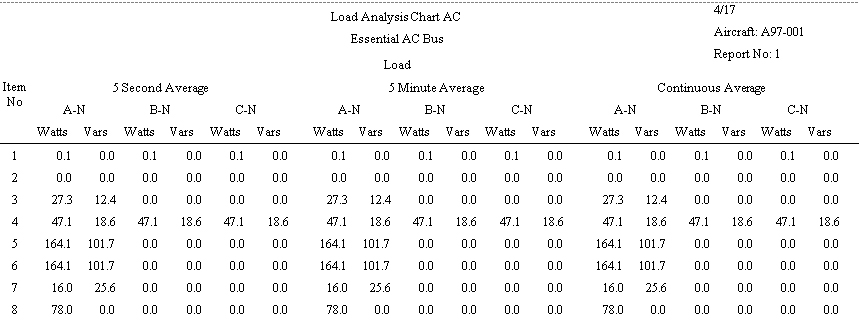
Figure 5: The hard facts. Calculations submitted to the aviation authorities need to be in accordance with industry standards, such as MIL-E-7016F. Reports can frequently run to 100 pages worth of data, and to calculate such a volume by hand (using multiple spreadsheets) is laborious and error-prone.
Catering for other industry standards should be possible too, as in theory it will just be a case of massaging the data and sums into a different format. Indeed, the RAAF wanted the calculations presented in a different report format, and we were able to accommodate that. Also, it is our current thinking that, subject to sufficient interest from industry, we will create formats as required for the commercial sector.
In Action
No engineering tool would be complete without considering how it is to be used and by whom. In this respect we identified three levels of user and built appropriate profiles; Normal User, Super User and Administrator. Both types of user can run what-if scenarios but only a Super User can make permanent changes to an aircraft’s configuration. Normal Users can only make temporary changes.
This approach supports the ‘Prepared By’ and ‘Checked By’ sign-off procedures that are common throughout the industry; as we wanted SERIES to dovetail with our existing QA processes.
The Administrator, a profile which is typically hidden from view, can access much deeper functions within the software, such as configuring the starting architecture (of the ELA) and editing the meta data of library components. The Administrator goes in via the ‘Security’ button shown on Figure 6.
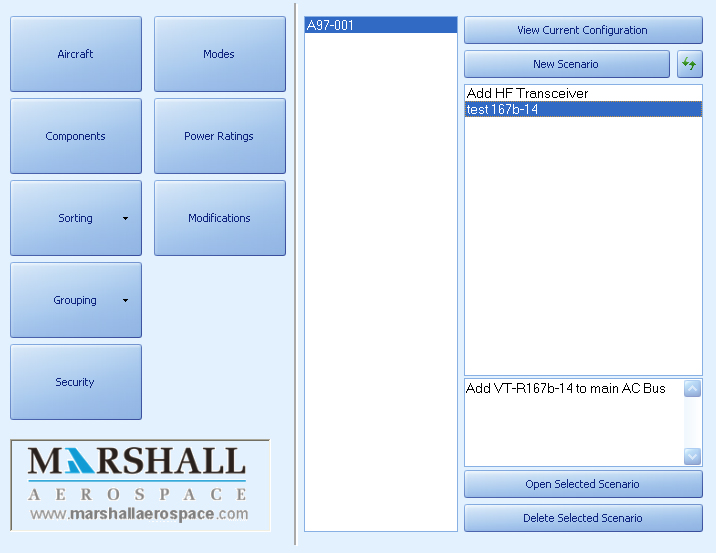
Figure 6: The frontend to SERIES:
- Aircraft is for managing platforms on either a fleet basis (as military operators may wish to do if all aircraft have the same configuration) or a tail number by tail number basis (as commercial operators may wish to do if aircraft are similar but not identical).
- Components accesses the library of loads.
- Sorting & Grouping enable data to be presented in different ways.
- Security is how the Administrator configures and controls the tool (as to be used by Super and Normal Users).
- Modes is where Short-, Medium- and Long-term loading can be controlled and results investigated (as per Figure 4).
- Power Ratings relates mainly to generators and batteries.
- Modifications launches a library of modifications, so that they can be explored on a case-by-case basis or in groups.
- View Current Configuration presents a view similar to that shown in Figure 1.
Note: Scenarios are effectively the ‘what-if’ investigations we wish to perform. SERIES has the ability to record what we’re doing, and the New, Open and Delete buttons are for managing those ‘recordings’.
To start an ELA, the tool must be set up by an Administrator. Super and Normal Users then work together trialling the loading of the system as described above. They can report back their findings at the preliminary and critical design review (PDR and CDR respectively) stages of the project; using tables and graphs from SERIES to support their findings. Once a configuration change is agreed upon (usually at the final design review or when the supplemental type certificate [STC] is confirmed) the fleet data can be updated and controlled on a tail number by tail number basis.
Present & Future
During the development of any software application, features will always be added, refined and moved around. SERIES was no exception to the rule, and we feel we have the balance just right to assist engineers and operators to execute their responsibilities. Moreover, we feel it was built in an extremely logical way – i.e. driven by avionics engineers.
Going back to the flaws of using spreadsheets for ELAs; because they are not dynamic enough to schedule load changes, the operator will, through the course of time, reach the conclusion that a proposed modification will push the generation system beyond its safe limit. Therefore an [expensive] upgrade to the electrical generation system will be deemed necessary: whereas, in reality, the safety factor tends to be larger than can be depicted by the spreadsheet method. Indeed, toggling between ‘Realistic’ and ‘Worst Case’ on our Chart output (Figure 5) frequently produces significantly different results.
We designed SERIES to help visualise the dynamic nature of an aircraft’s electrical system and to help engineers and operators draw a safety margin conclusion that is closer to reality than has previously been possible. Indeed, how many times have we been left wondering just how well the proposed upgrades to an aircraft have been captured in the prevailing ELA during the in-service period?
SERIES is a tool designed to work alongside the lifecycle of each fleet, with the ability to be updated as the configurations of its aircraft change. Indeed, SERIES is sufficiently versatile to be able to encompass changes to the generation systems within the fleet. Whether the user is operating a helicopter, a business jet or the latest military strike fighter, SERIES can be configured to help with the often crudely analysed electrical load situation.
Future versions will enable subscribing customers to point their internet browsers at a secure server and access the existing configuration of their fleets, run a variety of what-if scenarios, failure modes, update records and print reports.
Comments (0)
There are currently no comments about this article.
To post a comment, please login or subscribe.