Articles
| Name | Author | |
|---|---|---|
| Case Study: Greater accuracy brings greater efficiency at Norwegian | Stig Patey, Captain B737 / Manager Fuel Savings, Norwegian | View article |
| Case Study: Air France avoids the avoidable and stays a step ahead with eWAS | Mathieu Durang-Gobert, Flight Operations Support Manager, Air France | View article |
| Digitalize your ramp | Michael Muzik, Product Manager and Consultant, Lufthansa Systems | View article |
Case Study: Greater accuracy brings greater efficiency at Norwegian
Author: Stig Patey, Captain B737 / Manager Fuel Savings, Norwegian
Subscribe
Greater accuracy brings greater efficiency at Norwegian
Stig Patey, Captain B737 / Manager Fuel Saving at Norwegian shares the experience on saving emissions and fuel through advanced weather data
As the standfirst suggests, this article will be about how airlines can use advanced weather data to save emissions and fuel. I’m going to refer to a project that Norwegian has run with Avtech Sweden and in collaboration with the Swedish Energy Agency who can administer grants when there is a project that can save emissions and be good for the environment plus act as an independent auditor for projects. It has been interesting to participate in a project where there is a government agency. First, as the airline participant in the project and the business seeking to save on emissions and fuel, it will be useful to offer readers a brief profile of Norwegian.
NORWEGIAN
Norwegian is the fifth largest low-cost carrier in the world with around 10,000 dedicated colleagues operating around 500 routes to more than 150 destinations around the world. Currently ranked as the most fuel efficient airline operating across the Atlantic, Norwegian operated, at the time of writing, 118 Boeing 737 800, 8 737 MAX 8 (a growing fleet as new aircraft are delivered to replace older 737 models being phased out) and 31 787 Dreamliners.
THE PROJECT
Many vendors contact Norwegian with another new super product to save fuel and if we could select 50 solutions, each claiming to save 2%, we wouldn’t use much fuel at all. Naturally we need to pursue the most realistic and promising opportunities and identify the ones that might match Norwegian’s business processes.
At the outset of any project, there is a lot of uncertainty (figure 1).
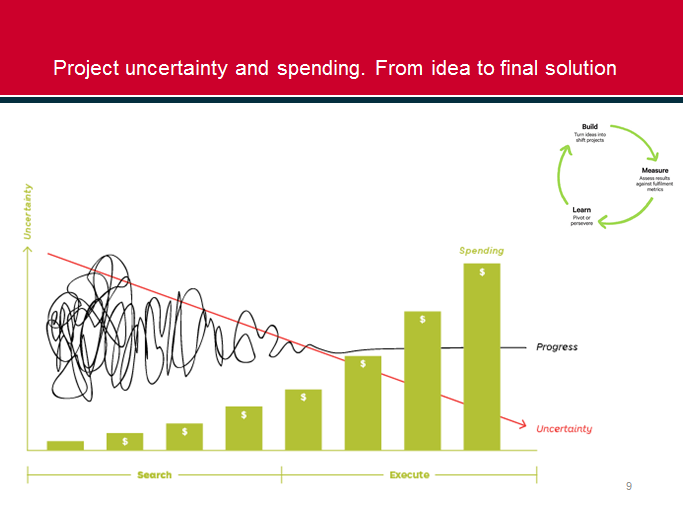
Figure 1
There is no indication whether it will work or not and there won’t be any enthusiasm to spend too much money. Therefore, it’s a good idea to start very small with a proof of concept, maybe a feasibility study, and, as that study progresses, if there is evidence that this actually works then maybe it will be a good idea to invest more money, allocate more people and build up the project. Readers will be familiar with the Lean cycle (top right of figure 1) in which you build, measure, learn… to fail fast in order to succeed sooner. So, whenever a vendor wants to approach an airline, it’s a good idea to try to make any proposal as small as possible in order to get across the threshold and get something started.
It’s also important to be clear on what is the value proposition. There are a lot of new systems being introduced. Potential customers see the green square box (figure 2), what the vendor will provide, but any potential customer also needs to know what kind of problems they, as an airline, have that the vendor’s solution might help – the red circle. The airline needs to identify what it needs to do, the pains and gains and how can it all be matched to the vendor’s proposed solution.
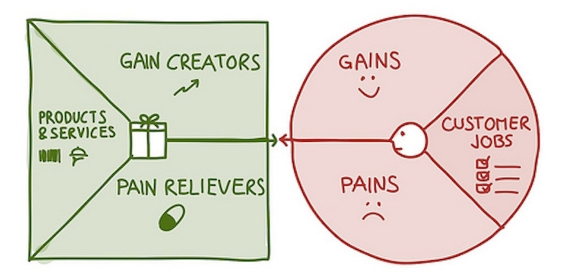
Figure 2
There needs to be a discussion to identify what is the most important thing that the airline would like to solve, the most pressing concern for the business, so that can be mapped into the solution being offered.
NORWEGIAN’S WIND PROJECT
One specific challenge identified by Norwegian was that wind is different at different levels. So you might find that, at FL (flight level) 360 there are 85 knots of wind while at FL 240 it is 45 knots: therefore, you might prefer to fly higher if it’s a tailwind whereas you’d want to fly lower if the wind is a headwind. Also, these wind areas can shift hourly which means that, to find the best flight level for the aircraft, airlines need that information.
Wind-altitude trade-off in Cruise phase
The flight management computer (FMC) on the 737 or any aircraft can show the optimum flight level, the one that is most fuel efficient or time and cost efficient according to the Cost Index at a given level. This will also change with weight of the aircraft. On the 737 it’s fairly simple, it doesn’t provide a recommended altitude which can be found on some aircraft models. In the example in figure 3, if the aircraft is flying with a strong tailwind further down it could be beneficial to trade off from the theoretical optimum altitude and fly lower in denser air if that can be offset with more tailwind.
And this is the breakeven wind; so, let’s say there is 15 knots stronger tailwind 4,000 ft. below the FMC optimum level; that would be just a breakeven trade-off. In the example, we have a 737 with a weight of 61.5 tons for which the FMC will calculate that the optimum level is FL 390. But if there’s a stronger tailwind at other levels, for example at FL 330 there is a 45 knots tailwind, that is 17 knots more than the breakeven wind, so that’s the excess wind beyond the breakeven point and offers a fuel saving of 3.7%
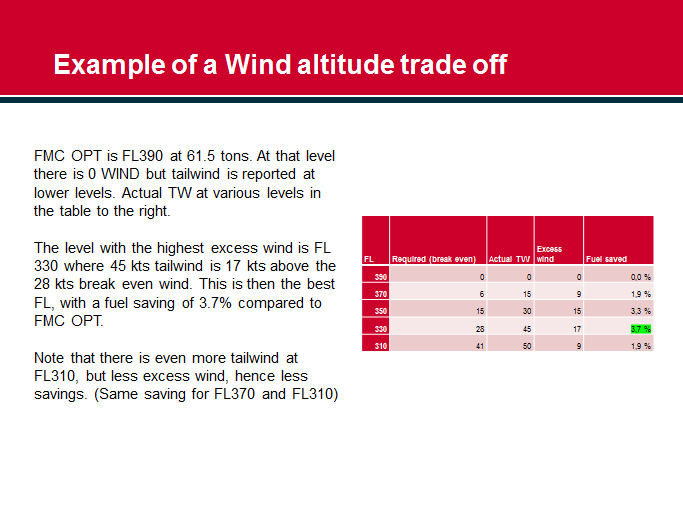
Figure 3
Further down, at FL 310, there’s even more tailwind but it doesn’t offset the penalty for flying that low. So, in this case, the optimum level for wind correction would be FL 330.
In order to do these kinds of wind-altitude trade-offs, requires the most accurate wind information and, if you’re flying close to a Jetstream, wind can change hourly. So, if the weather in the flight planning system is already six or seven hours old, it might be less accurate.
Wind-altitude trade-off in Descent
Readers will be aware of the top of descent where the aircraft leaves Cruise level and starts to go down for landing; this point has to be calculated by the FMC. It can be at roughly three times altitude as lateral distance in nautical miles from landing but the FMC will make a more exact calculation taking into account the aircraft altitude, weight, Cost Index, the use of anti-ice, wind and temperature. On some models, the econ descent speed itself is also adjusted for wind (not on the 737 800 but on the 737 MAX) The top of descent point is adjusted based on wind expected during descent; so if it’s going to be a strong tailwind, it would be necessary to descend earlier; with a strong headwind it would be necessary to descend later. However, if the wind is different from expected, the descent calculation will not be correct. If the descent starts too early, there will have to be compensation at a lower altitude, maybe a level-off segment or a partial thrust descent which all costs a lot of fuel. If the descent starts too late, that also costs money because the aircraft will have spent time in cruise when it could have been in an idle thrust descent. That will have to be compensated by either higher speed during descent or extended speed breaks: either way, efficiency will be lost. There is a need to optimize how the FMC calculates the top of descent for which it needs accurate wind and accurate temperature.
AVTECH’S PROPOSITION TO NORWEGIAN
Avtech proposed to Norwegian a high resolution weather system (figure 4)…
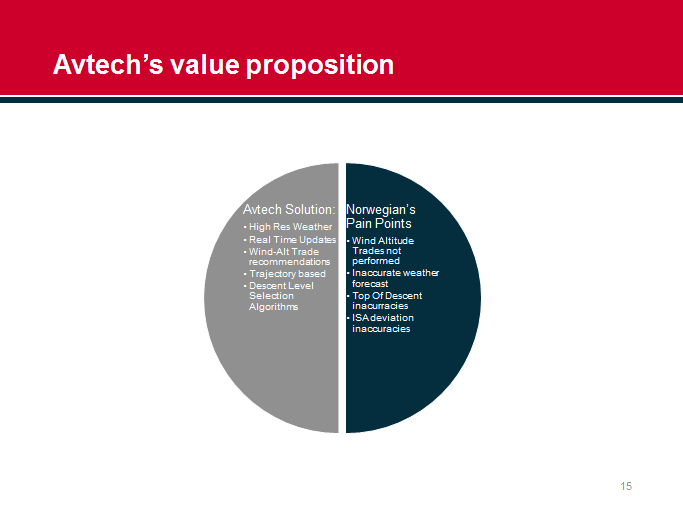
Figure 4
… with real time updates and interpolation between values to ensure that the information is the most accurate possible. It offered wind-altitude trade-off recommendations based on the most accurate trajectory flown and even if the route is changed in flight, on some aircraft it can send a communication down to Avtech’s system and get a revised wind report based on the expected standard arrival route. There is also a descent level selection algorithm that I’ll refer to again later.
There are two parts to the system that Norwegian uses for wind and temperature (figure 5). There’s the Nowcast system for Autoload capable aircraft (FANS); then there’s the Air version for non-Autoload aircraft where the information is delivered as a paper print-out for the flight crew to enter manually. The Air version was part of the trial with the Swedish Energy Agency to verify whether this idea could generate any savings at all in terms of fuel.
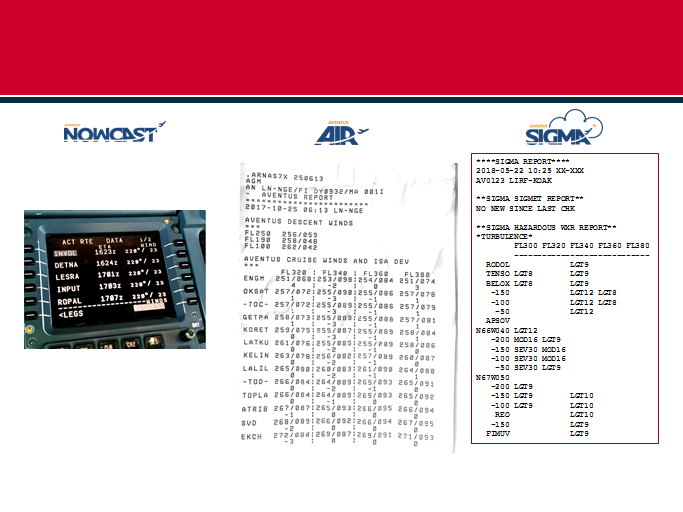
Figure 5
Looking at the version on the left, Nowcast, it sends information straight to the FMC so the pilot only needs to accept the uplink and then they get the exact winds into all the waypoints and the descent forecast page on the FMC. The Air version in the middle shows the paper printout from which the flight crew would select the relevant values and enter them to the FMC – they don’t need to type in everything, just the information for the flight level at which they are cruising. This one has been updated to provide more wind-altitude trade recommendations.
Also, as can be seen, there’s another system from Avtech, called Sigma, which provides high resolution turbulence and significant weather forecasts. This is beneficial for longer flights over sea areas where there is light, medium or even severe turbulence. The system offers high accuracy and is mapped to waypoints so that the pilot can see where there is light, medium or severe turbulence.
NORWEGIAN’S PROJECT
Norwegian started with the Aventus Air version on the Boeing 737-800 fleet, followed by the Nowcast version on the 737 MAX and 787 Dreamliners and, finally, the Sigma system on the 737 MAX and 787 Dreamliners. The Swedish Energy Agency provided support throughout the project, partly funded the project, and audited the report and findings following which they published a final report.
Weather forecast
The default weather available from typical systems uses a forecast grid of 140km whereas the Avtech system takes a high resolution 10km grid version with tighter time intervals between updates as well as interpolating between these and adding the actual route to be operated. The effect of that, we measured, was a 50% reduction in wind error (figure 6).
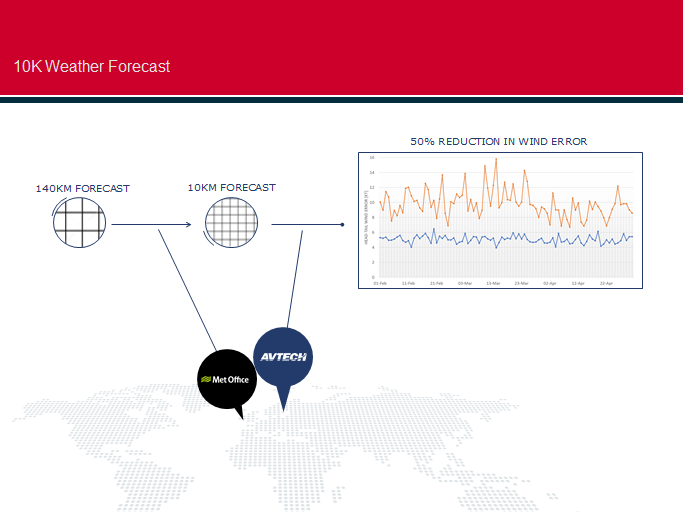
Figure 6
We measured on all the flights what is the flight planned prediction of wind at any waypoint and the wind we actually had, based on FDM (flight data monitoring) data and then the wind as predicted by Avtech – the blue line of the graph.
The FMC wind error reduction is really interesting (figure 7).
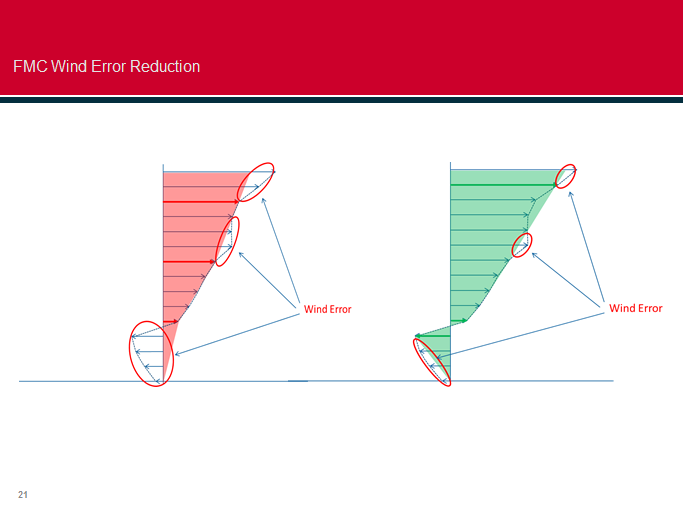
Figure 7
On the 737, the flight crew can only enter three winds to the flight management computer’s descent forecast page: pilots can select any levels they like but only three values can be entered for descent wind; then the FMC will linearly interpolate between those values with a straight line – that will be the line on top of the red example in figure 7 with three red lines being the ones that have been input to the FMC with a straight line in between, and all the other vectors there are the actual winds during the descent. Where there is a white space, lower left, that’s the wind error, the difference between what the FMC believes the descent wind to be and the actual wind. Plus, there is a shift in wind at the low level at, say 5000ft, with the wind changing from a headwind to a tailwind which won’t be captured if just three wind levels are entered. On the green example, the Avtech winds have measured where the wind shift is and then made sure that on the uplink to flight crew there will be a wind vector catering for that tailwind. So now, the small area where there is a wind error can be seen to be much less. This will increase the accuracy of the top of descent, improve Vnav (vertical navigation) performance at lower levels to ensure that, for example RNPAR (Required Navigation Performance – Authorization Required) can be executed with less speed deviations and, in general, improve the flight crew confidence in all stages.
TRIAL
Trial setup
We did a trial with providing the Avtech Air solution to the entire Norwegian 737 fleet, delivered to the flight deck eight minutes after take-off when a printout came automatically from ACARS for the pilot to review the values and enter them into the FMC. On the aircraft with the Nowcast option, it was sent straight to the CDU (control and display unit) on the FMC and the flight crew received a prompt to execute and accept the wind uplink. All the flight data on the FDM was analysed with the actual wind experience compared with the wind predicted by Avtech and the wind provided from the flight planning provider. It was analysed for cruise phase and descent phase
Trial results
The results of the trial showed first the head and tail wind error in descent (figure 8).
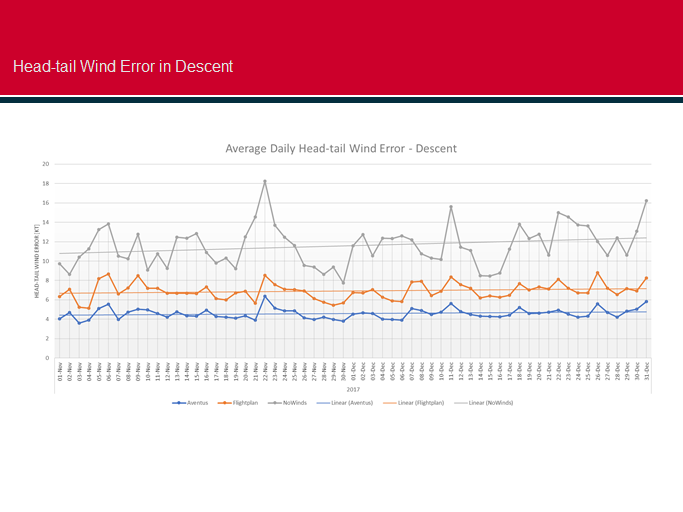
Figure 8
The grey line represents the wind error that would be in FMC descent predictions if no winds at all were entered when the FMC would default to whatever is the cruise level wind and linearly interpolate from that. The orange line there is based on the flight planning system. And the blue line is from Avtech.
Figure 9 shows an average fuel saving per flight from a relatively high volume of flights.
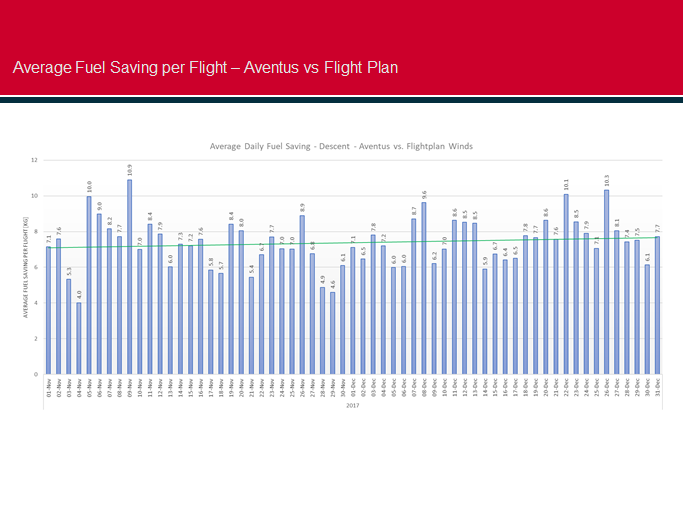
Figure 9
It can be seen that there are some peaks, it’s not evenly distributed. The fuel saving in descent is based on measuring the wind error and how this translates into a fuel saving. Obviously, we cannot change how the wind is in reality, but having more accurate data gives a better prediction of top of descent which translates into a fuel saving. This fuel saving cannot be measured specifically because the numbers are still so small and there’s a lot of scattering of data, we’re not sure about any error for weight or the engine efficiency. When a huge volume of flights have been completed, it will be possible to achieve some statistical significance and better validate all the results, but, for this trial, we calculated the fuel burn using the flight plan winds compared to the actual winds and looked at what would be the fuel increment resulting from that lack of accuracy compared to the Aventus winds with higher levels of accuracy and then this delta fuel burn is what can be seen.
Figure 10 shows the air distance for a descent from a given level dependent on the ISA temperature deviations.
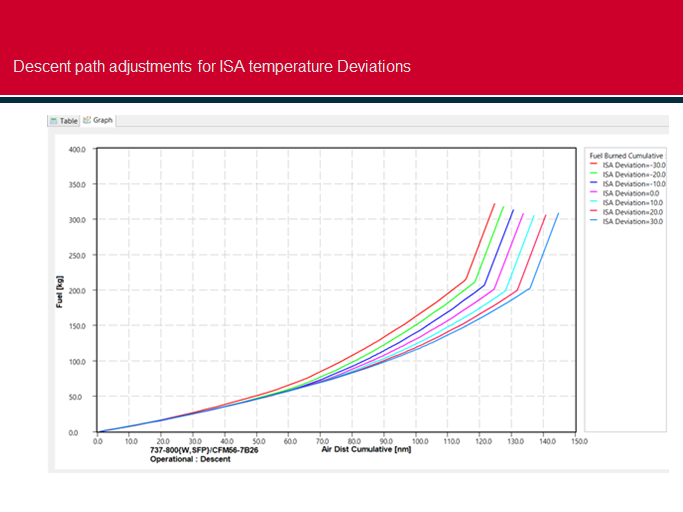
Figure 10
The temperature of the air affects the distance required for a descent. If there are inaccurate ISA deviations the FMC will get inaccuracies as well. The temperature forecasts that Norwegian got from Avtech was almost spot on with the actual temperature from the FDM (flight data monitoring) data. Compared to the flight plan, there was more accurate temperature.
Combining the wind error and the ISA deviation errors (figure 11) there is some benefit from this all. These benefits can be additive, can cancel out each other, it depends randomly, but still it provides a benefit.
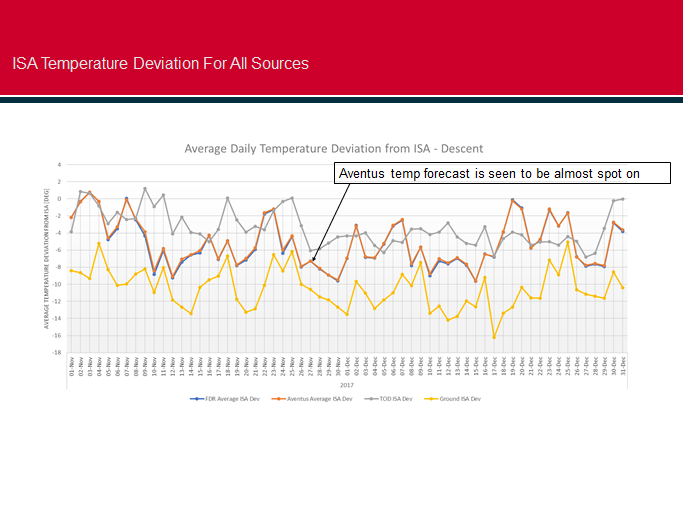
Figure 11
Figure 12 shows the fuel penalty during descent and Aventus has a small penalty, compared with if there were a perfect world with no errors, and several kilos less than the flight plan.
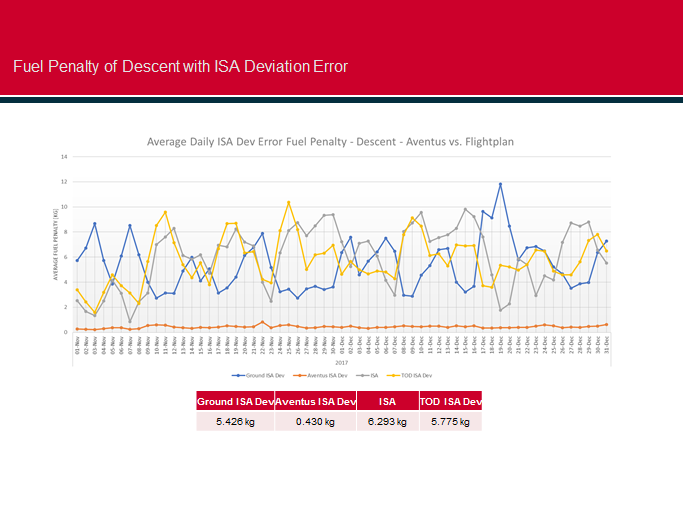
Figure 12
In cruise (figure 13) it can be seen that the flight plan, on average, added at least 8 knots error from the actual winds and Aventus about 4 knots.
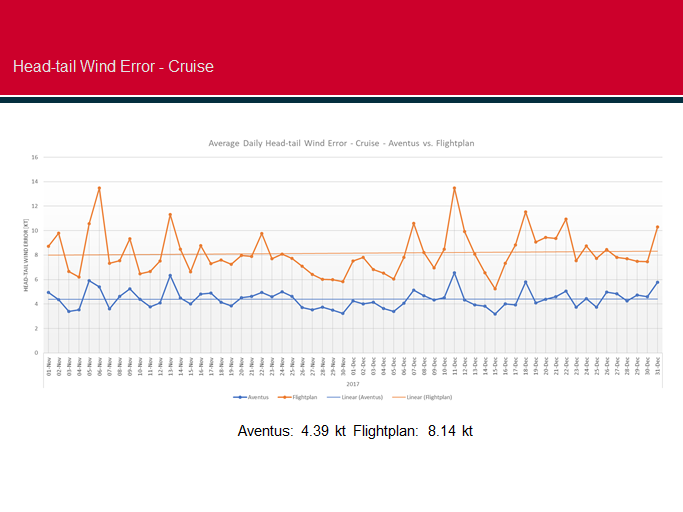
Figure 13
This is the average. On some flights there was a significant difference between the flight plan and the actual, whereas Aventis was able to maintain a high level of accuracy for all flights. The benefit is not only these 4 knots of improvement but also that there’s less variation in the data; it’s more consistent. But, does having more accurate winds into the flight management computer for the cruise phase really improve the fuel burn? Not necessarily (figure 14).
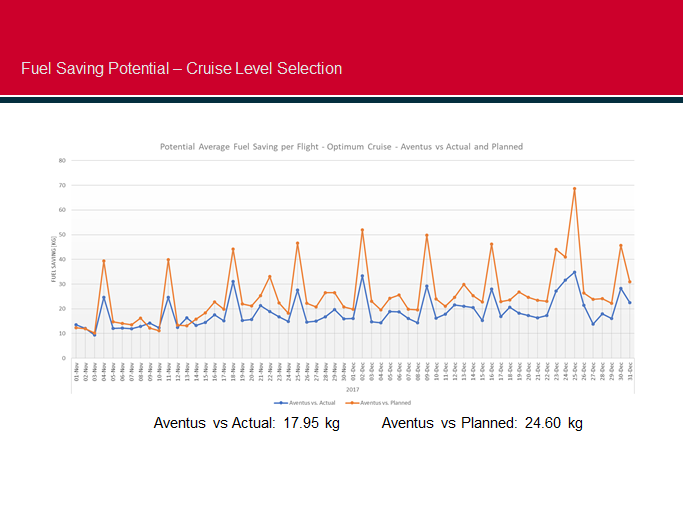
Figure 14
The FMC optimizes the speed based on the Cost Index, the weight and the wind. But for the actual position right now the FMC will use the wind measured in flight: however, for the predictions down path further down the road, it blends that in with the predictions. There’s a blend of predictive wind and actual measured wind. At any point where the aircraft is now, the FMC uses the actual wind at that point. The benefit in having more accurate winds is, for cruise, better arrival time and fuel predictions. Also, Avtech not only provides wind at the aircraft’s current level but at levels above and below the aircraft to facilitate the evaluation of wind-altitude trade-offs: that’s when it comes in handy and where we generated real savings.
The savings were related to cruise level selection and we compared how flight crews were able to save fuel flying a different level than the one originally planned. So we measured what would ideally be the optimum flight level for a flight with all the wind-altitude trades: what was this level and what was the level the flight planning system provided, what’s the delta fuel burn between those two and then we looked at the level predicted by Avtech which resulted in the graph in figure 14.
WEATHER ANALYSIS
As we saw above, there were some spikes in the data with more inaccuracies some days than others in the winds provided by the flight planning provider compared to the actual and we started to analyse these particularly with the descent into Oslo airport (figure 15.1).
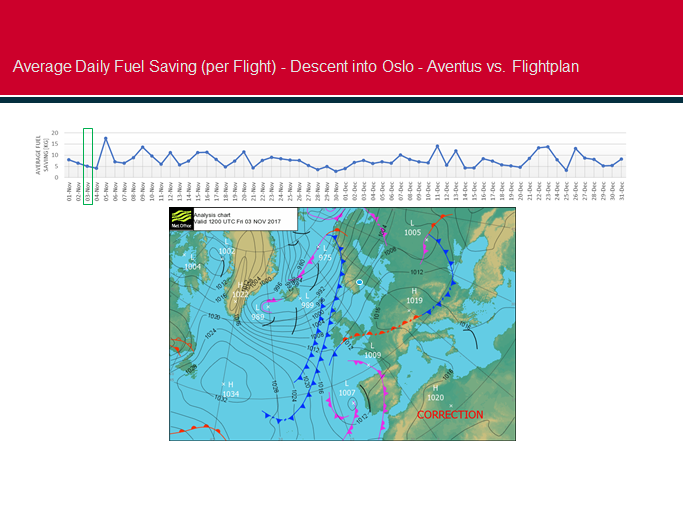
Figure 15.1
On this map, you’ll see Norway at the top centre and the blue dot that marks Oslo while, in the upper left hand corner, there is a green rectangular box showing the fuel saving on descent. On the date pictured, there is no particular weather at Oslo. And the fuel saving is rather small. On the next day the same but there was a cold front pushing from the West so that the following day the front was just over Oslo and the fuel savings potential increased (figure 15.2).
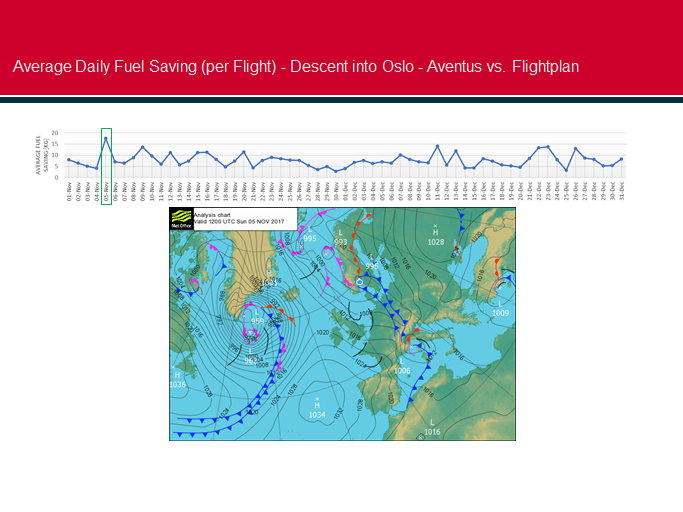
Figure 15.2
This is consistent with the weather charts all the way through, i.e. the days where there was a lot of fuel saving potential, using the Avtech system, were typically days when there was a lot of weather over Oslo. If there is a storm coming in, the descent forecast can change from minute to minute which is why it pays to have an accurate system that provides updated data. On a day when the weather was clear, the flight plan weather was more than good enough, there were no big changes.
In addition to our measuring the improvements, we also wanted pilot feedback so we sent out a survey to the pilots (it can bring out the best and the worst in people!) which showed some pilots were really happy using the Aventus system and other not so much, so the full bell curve of replies. We had 1,500 pilots on the first of our two surveys. User satisfaction was relatively good at about 7 or 8 from a potential score of 12. We asked a series of questions about their use of the Aventus system and received mainly positive feedback. The outcome was that most pilots said it worked OK, not much change, or it worked very well and the benefits were achieved. Only 2% said that, for them, it didn’t work at all.
FINAL REPORT
The Swedish Energy Agency read the data on the 737 (not the 787) so most of the flights were short flights and there was an average of 22kg of fuel save for each flight based on this trial and it’s something that Norwegian will be continuing with to further evaluate. We took the uncertainties that we have and ran through them 10,000 times in a Monte Carlo simulation (figure 16) which suggested that the fuel saving on those 737 flights was around 0.2%.
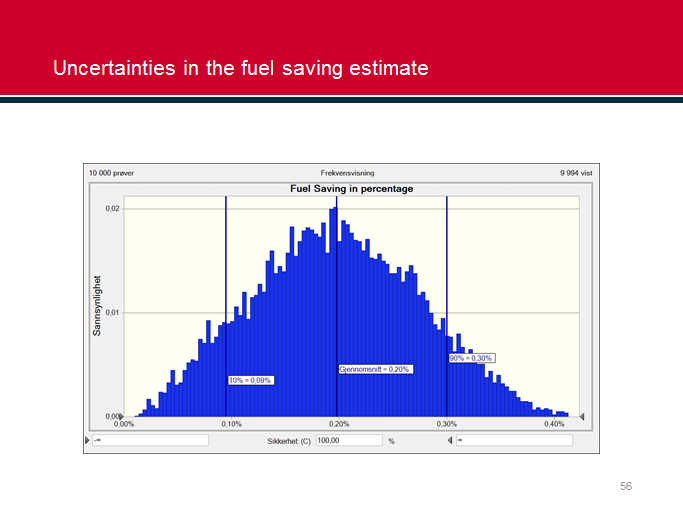
Figure 16
We have certainly appreciated the value of accurate and more detailed weather inputs at Norwegian and I hope that you have gained some value from reading about our experience.
Contributor’s Details
 Stig Patey
Stig has been with Norwegian as a pilot since 2006 and manages fuel and cost saving initiatives in the company, which currently is ranked as the most fuel efficient airline across the Atlantic by ICCT. He is mostly in his office but gets the chance to fly as a captain on the B737 now and then.
Norwegian

Norwegian is the fifth largest low-cost carrier in the world with around 10,000 dedicated colleagues. Our customers can choose from around 500 routes to more than 150 destinations. The fleet includes Boeing 737 800s, 737 MAX and 787 Dreamliners.
AVTECH

AVTECH – the modern weather uplink solution, delivered to the cockpit via ACARS or Wi-Fi is based on a unique Met Office (UK) 10KM global aviation weather model. AVTECH brings unique weather solutions to the aviation community, giving airline customers a possibility to improve efficiency, safety and comfort.
Met Office

As a world leader in providing weather and climate services the Met Office advise all sectors of the aviation industry – airlines, airports, air traffic control and management, ground handling, airport construction and maintenance – to help the aviation industry increase safety and achieve operational efficiencies and cost savings.
Comments (0)
There are currently no comments about this article.
To post a comment, please login or subscribe.