Articles
| Name | Author | |
|---|---|---|
| Column: The World according to IT and me.. Future Visions | Paul Saunders, Solution Manager, Flatirons Solutions | View article |
| How to implement a successful EFB project | Wim De Munck, Chief Technology Officer, AvioVision N.V. | View article |
| EFB: To buy or to build? | Captain Andy Jones, EFB Project Team, and Shaun Landy, Flight Operations Manager, Thomas Cook Airlines | View article |
| Improved flight planning tools and in-flight EFB | Pieter Steurbaut, Operational Efficiency Manager, Brussels Airlines | View article |
| Data connectivity for EFBs Part 1 | Bill Vlases, Manager EFB Solutions, Boeing | View article |
Improved flight planning tools and in-flight EFB
Author: Pieter Steurbaut, Operational Efficiency Manager, Brussels Airlines
SubscribeImproved flight planning tools and in-flight EFB
Pieter Steurbaut, Operational Efficiency Manager at Brussels Airlines explains how the operator saved fuel, saved time and saved money
Fuel efficiency history at Brussels Airlines
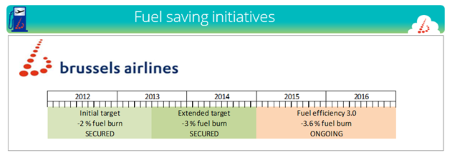
This article is about the flight planning improvement program at Brussels Airlines and plans for using the EFB in flight optimization. Brussels Airlines has run fuel efficiency projects since 2008 when the first fuel price surge occurred. In January 2012, the management decided to expand those programs by adding new initiatives. The initial saving target was set at €6 million; two percent on an annual fuel bill of about €300 million. We reached this target in mid-2013, at which point the target was extended to three percent. This target was, in turn, achieved by the end of 2014. In ‘Fuel Efficiency 3.0’, our third and current program, the objective is to save at least 3.6 percent on fuel costs with a potential for an overall four percent saving. This article is about the progress we have made so far.
Running a fuel efficiency project is a team effort. Mrs Bianca de Backer, first officer on our Airbus A330 fleet, adds the pilot’s point of view to our fuel saving ideas. Of course, we work with other departments in the business – ground operations, maintenance and engineering, the commercial department, the in-flight service department – and within the Lufthansa Group; communicating with other fuel efficiency managers in the different group companies.
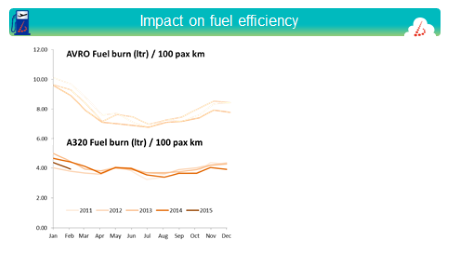
In 2012, we targeted our Avro fleet for fuel efficiency flight planning because its fuel burn rate, at that time, was close to 7 litres per 100 pax kilometres (see diagram above), offering significant potential for savings compared to our A320 fleet whose fuel burn rate was closer to 4 litres per 100 pax kilometres. By 2012 we had already applied a number of fuel saving initiatives: ‘Reduced flaps landing’, ‘3 engine taxi-in’, use of ground power units, weight reduction, and in-flight speed reduction. Also in 2012, we introduced speed tables (a Cost Index principle – see below) and in 2013 we switched to more lightweight equipment. In 2014 we implemented the real fuel saver of Cost Index flight planning on the Avro fleet followed at the end of 2014 by new flight planning software which incorporated additional fuel saving elements.
Cost Index
Cost Index is all about the balance between time cost and fuel cost, the two principle cost drivers for an airline if it is not picking up delays (an important element one always has to take into consideration). The way it works is straightforward; the airline may decide to fly very fast to achieve a low flight time or very slowly with a consequent longer flight time. The cost for crew and maintenance is linear with the flight time as are some maintenance costs and flight hours’ related costs; so these will increase if the flight time is extended by a reduction in speed. On the other hand, reduced speed will deliver a lower fuel burn and results in lower fuel costs. The sum of these cost drivers will make up the total cost of a flight and the objective is to minimize total cost by getting the right balance between speed and time. To save the very last drop of fuel, it will be necessary to fly at Cost Index zero; but that will generate a higher total cost than the lowest possible cost. On the other hand, to make-up for an earlier delay or if it is important to arrive before a certain time (say, to avoid a curfew at an airport that closes at night), flying at maximum speed will also result in a total cost higher than the minimum possible.
Fuel saving in the flight plan
Implementing the Cost Index principle in an operational flight plan (OFP) entails providing pilots with the speeds that they have to fly at optimum flight level by incorporating Cost Index outcomes into the OFP.
With the support of the flight performance specialists at the German company PACE, we conducted an initial testing program. On the Avro fleet, we anticipated a 4.5 percent saving of fuel (about 120 kilos of fuel per flight hour). Even after taking into account time costs the total net saving was equivalent to 40 kilos of fuel per flight hour. But there were some significant concerns: the average flight time for the test flights had increased and the pilots had to alter speeds when wind conditions changed, when they changed flight level or when the course changed… each of these meant they had to adjust speed, which is still a manual process on the Avro aircraft type.
Due to these concerns, it took nine months before we cleared all doubts and got final approval to start the program.
Considering the variable factors in flight efficiency
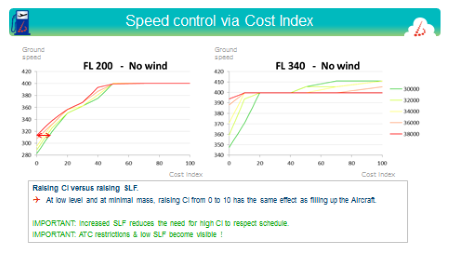
After some initial fine-tuning, we noticed that, for routes with severe level capping and with a lower mass, predicted flight times were higher than expected. We also noticed that the actual flight times did not increase, although that was predicted by the test flights. We immediately started an in-depth analysis of the first days of operation and we discovered an increased compensation for the wind effect. In the Cost Index philosophy, if there is a headwind, the flight planning system will accelerate the aircraft; whereas, for a tailwind, the system will reduce speed to take advantage of the wind. Comparing that to a fixed Mach planning, flying the same airspeed independent of the wind, the new system offers a big advantage, as is shown on the graph below…
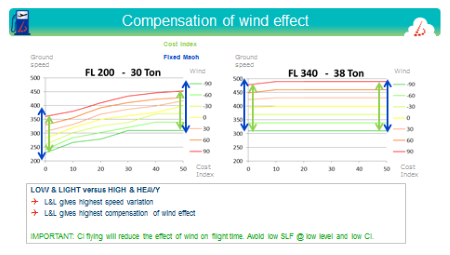
… the first chart is a simulation for an aircraft weighing 30 tons at flight level 200 with winds varying between a headwind of 90 knots and a tailwind of 90 knots. For a Cost Index of zero, with a 90 knots headwind, the aircraft flies at 230 knots while, with a tailwind, that will be 370 knots, a difference of about 140 knots. A flight at a fixed Mach would fly at the designated airspeed but ground speed would be affected by the wind speed between +90 knots and -90 knots, a difference of 180 knots. So, the wind effect is reduced from 180 to 140 knots when flying Cost Index.
With Operations on higher flight levels, and with heavier aircraft, the effect is less. So that was already one of the clues why, at low flight levels, we saw this big difference on flown block times. Cost Index flying reduces the effect of wind on the flight time but you have to avoid flying at low levels which, from a fuel efficiency and economy perspective also makes sense.
The effect of mass is another important consideration: an aircraft’s speed will vary with its mass; the diagram below shows the difference between a very heavy aircraft and a very light aircraft and the effect on the ground speed is equivalent to the effect of 20 knots of wind. So, this means that a heavily loaded aircraft will fly faster making it easier to match the schedule – another interesting point. So flying fully loaded planes effectively reduces the flight times – economy and efficiency again go hand in hand.
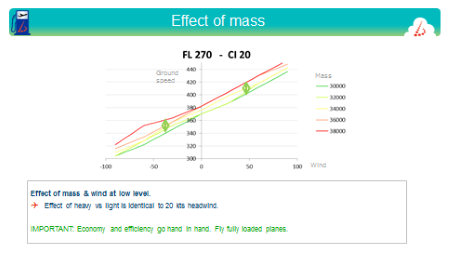
Then there is of course speed control. The graphic below shows that, when the cost index is raised, the ground speed is increased, as expected. However, these graphics don’t show the planned flight levels: flying at very high cost indexes will also automatically lower flight levels and that will provide an additional degree of freedom to control the flight time.
Looking at the situation before and after; 50% of flights came in at minus three minutes (3 minutes early on schedule) before the new system was implemented, i.e. they gained three minutes in the flight. That didn’t really change with the implementation of Cost index flying – the average was more or less the same. But, looking at dispersion, we clearly see that dispersion has reduced. We found that 90% of flights came in at five minutes or less of delay while previously that had been seven minutes.
So, on average, there is a gain of approximately 1.5 minutes on critical block times due to Cost Index generating better compensation for wind effect in the flight planning system. That was an interesting finding because there were initial concerns on network stability due to (expected) increasing flight times. The new system actually provided an improvement in this area.
Bringing it all together for fuel efficiency
Of course, all this is excellent news but what did it mean in terms of fuel efficiency? The graphic below is one of our first graphs to show the impact on fuel burn of our new method. When we look at the number of litres burned per 100 pax kilometres, the result is quite impressive.
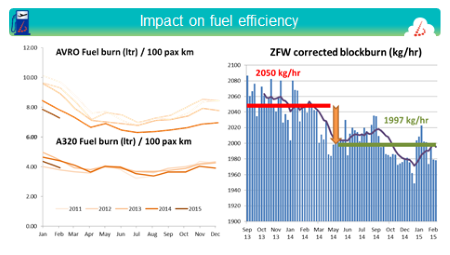
Bear in mind, we had increased the seat/load factor of the aircraft which also came into play in this case inasmuch as an increase in seat/load factor will reduce fuel burn per 100 pax kilometres. To filter out this effect, we took a standard zero fuel weight and recalculated the fuel burn to that standard zero fuel weight taking into account the adjustment of fuel burn for any weight difference.
The result is shown on the right-hand graph. The average fuel burn per hour fell from 2050 kg/hr to 1997 kg/hr, 2.5% saving over our previous operations methods. Initial estimates had suggested 4.5% saving but because we had by now started with a version of Cost Index flying in a simple way with the speed tables, we had already obtained a degree of advantage compared to fixed Mach flying. Taking everything into account, we were confident that, had we moved directly from fixed Mach flying to Cost Index flying, we would have achieved that 4.5% saving.
Lessons learned and…
We completed our mission with satisfaction as we reached the project objectives. We learned several lessons out of our experience. . In the first place we can confirm that fixed Mach planning is sub-optimal because it doesn’t adapt the speed for the weight of the aircraft, it doesn’t adapt the speed to take account the wind influence and it has a restricted flight time management potential. On the other hand, with Cost Index flying, it is possible to partially compensate for wind effects and optimize speeds for mass and flight level; users have more cost efficient flight time management because they manage both speed and flight level offering two degrees of freedom that can be adjusted; and inefficient routes (low seat/load factor, ATC restrictions) are highlighted in the flight times. So, a fuel efficiency manager knows right away where to go and look once Cost Index flying has been implemented.
… questions arising
When we concluded above that everybody was happy with the new fuel efficiency program, that wasn’t entirely true. A few pilots came back to us asking what speeds to fly in case of ATC imposed flight level restrictions.
It‘s great that pilots wanted to be as efficient as possible, but we had to be honest and tell them that, for the time being, we didn’t have an immediate solution. We looked at it from the aerodynamics point of view and proposed that, if they flew at the same indicated airspeed, they would be close to optimal. Another question was related to the best strategy to adopt in case we needed to speed up the flight due to, for example, connecting flights. Again, we didn’t have a ready-made answer. And what if, for example, the flight plan was made with a flight level capping, but ATC lifted this restriction in flight? At what speed do we then fly at the higher flight level?
These were all questions to which we didn’t have answers but we promised the pilots a solution. PACE, the supplier of the system that we used for Cost Index flight planning, came up with an EFB (Electronic Flight Bag) in-flight optimization tool, Pacelab CI OPS. This tool calculates the optimal speed and flight level in real time and – according to our estimates – will yield another one percent of savings. The only problem was that, at that time, we didn’t have a system capable of recalculating these flight parameters on board the aircraft.
Electronic Flight Bag (EFB) program and the future
At the start of 2015, we’ve stepped into an EFB program and are currently working towards full implementation; 85% of our pilots are equipped with EFB today and we plan to have Pacelab CI OPS installed on all our Avros even though we will be phasing out that aircraft in 2017. Although the in-service time will be very short, it is a worthwhile investment due to the additional fuel savings that we will be able to achieve.
For the Avro fleet we will have the Pacelab CI OPS suite which will be fed by OFP (Operational Flight Plan) data via the pilot’s EFB. The pilots will provide the flight data to CI OPS and will, in return, obtain the optimal flight level, optimal speed and the most economical trip.
On the Airbus A 330, we will undertake the investment to hook up the system to the aircraft systems for real-time data and we are planning to deliver regular weather updates to complete the whole picture. This approach, with an EFB software named OPTI and delivered by PACE, will provide a similar output in an automated way… optimal flight level, optimal speed and lowest cost operation at every moment of the flight. We expect an additional 1% of fuel saving on our long-haul fleet.
EFB based in-flight optimization tools will complement the FMS (Flight Management System) with a modern tablet having tremendous calculating power and memory to be able to use ‘first principle’ data right away. This is possible because these devices only have to calculate one single flight at a time as opposed to Flight Planning systems on the ground having to calculate several hundred flights.
That is the direction we are going to and we hope to have it implemented in 2016. We are quite ambitious when it comes to our EFB program; in just one year we want to go from a paper operation to a full paperless operation with electronic flight folder and inflight optimization plus the fuel savings that go with it.
Contributor’s Details

Pieter Steurbaut
Pieter Steurbaut graduated as an electro-mechanical engineer and obtained a master degree in aircraft structures. He was head of aircraft design and testing for the company Avions Robin in Dijon/France and was aircraft heavy maintenance manager for both Sabena Technics and Brussels Airlines in Belgium. In 2013 he gained an executive MBA and has worked on Brussels Airlines’ fuel efficiency project since January 2013, increasing the fuel efficiency of the flight operations by a steady 1% per year over the past three years.

Brussels Airlines
Brussels Airlines is the largest Belgian airline and the country’s national carrier, priding itself on offering customers a safe, reliable, punctual, caring and innovative service ‘with a smile’ at a very competitive price. The airline serves destinations in Europe and Africa plus flights to USA with a modern fleet of Airbus(long and medium haul) and Avro aircraft.
Comments (0)
There are currently no comments about this article.
To post a comment, please login or subscribe.