Articles
| Name | Author | |
|---|---|---|
| The Next Big Shift in Airline MRO Analytics | Baiju Jacob, Director and Global Head of MRO Practice, and Manuel Fernandes, Digital Subject Matter Expert & Senior Consultant, MRO Practice, Hexaware Technologies | View article |
| Case Study: Making everything work better | John Hancock, Editor, Aircraft IT | View article |
| Case Study: Controlling Aircraft Tooling using RFID Technology | Jakob Heegaard, Director IT, Jet Time | View article |
| Case Study: Innovations in Aircraft Maintenance at easyJet | Gareth Thomas, Application Manager, easyJet | View article |
| Case Study: Using an M&E IT solution to manage CAMO operations | Yuliya Kornyeva, Senior Project Manager, FL Technics | View article |
The Next Big Shift in Airline MRO Analytics
Author: Baiju Jacob, Director and Global Head of MRO Practice, and Manuel Fernandes, Digital Subject Matter Expert & Senior Consultant, MRO Practice, Hexaware Technologies
SubscribeThe Next Big Shift in Airline MRO Analytics

Baiju Jacob, Director and Global Head of MRO Practice and Manuel Fernandes, digital subject matter expert & Senior Consultant, at MRO Practice, Hexaware explain how analytics has progressed from descriptive to predictive to prescriptive
INTRODUCTION TO HEXAWARE
Traditional IT is shrinking; the age of large mainframes, huge data centers, and an army of IT staff supporting them are shifting towards increasing automation and more digital processes. Digital is growing and businesses like ours help customers make that shift. So what does this transition imply for MRO?
The MRO practice has been one of Hexaware’s focus areas for many years. We have developed a range of solutions and services to cover maintenance organizations’ needs for the journey from data to digital (Data2Digital). As we mentioned above, the Aviation MRO industry is experiencing the shrinking of traditional IT with many players moving from custom legacy software to a modern, new generation of MRO applications which help in moving to digital. Also, business processes are being automated with ‘straight-through’ processing or with the use of boards which have now come in to play.
At Hexaware, we are growing our digital side which includes mobility and wearables such as Hololens. We are also increasingly moving towards development of big data solutions that help our clients with predictive maintenance as well as inventory optimization.

THE EVOLVING ROLE OF ANALYTICS – FROM DESCRIPTIVE TO PRESCRIPTIVE ANALYTICS
For this article we’re going to focus on Analytics or insights and actions which will help our industry save significant costs and become more efficient by reducing AOG (aircraft on ground) events, along with optimum management of all resources and predictive maintenance.
Evolving Analytics
From Descriptive to Predictive to Prescriptive
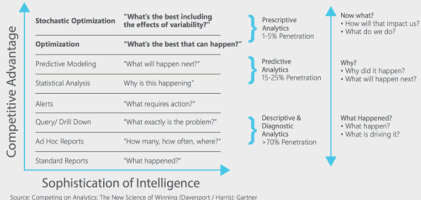
Analytics have been evolving constantly: for instance, a few years ago, it could best be described as descriptive – telling users what was happening in their engineering and maintenance areas and what was driving it. Descriptive analytics still accounts for about 70% of the analytics done in MRO and maintenance areas.
The next level involves predictive analytics, which is more sophisticated and tells users why something has happened, and what will happen next. There are various predictive models that we’ll cover.
Now, a new form of analytics is appearing, which is prescriptive; it not only tells the user what will happen but also how it will impact them and what they need to do, in order to minimize that impact. As of now, less than 20% of analytics fall into the predictive and prescriptive categories. However, the more insight leveraged from analytics, the greater the competitive advantage for the user. But then, achieving these advantages will increasingly call for systems with greater sophistication and complexity.
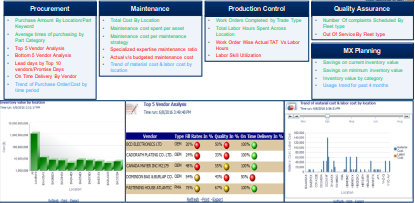
To better explain , with descriptive analytics, the first stage is ‘descriptive’ and tells users only what happened in the past – by parts purchased, by location, or by particular KPIs – i.e., information about the user’s existing or historical data. The next level is ‘diagnostic’ which tells users what is happening with certain types of data. For example, if we look at the top five vendor analysis, it diagnoses the vendor data and tells the user how those vendors are performing on various levels such as fill rates, quality, etc. One level further is ‘trend analytics’, which identifies certain trends and highlights where they are going: for example, the trend of material and labor costs for a particular location over a known period of time. This is a basic analysis of the user’s data and can be available at an organization level as well. In addition, it doesn’t involve too much sophistication, and is a basic first step for a user starting off on analytics.
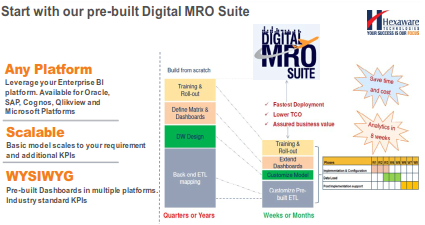
There are various packages available in the market to provide analytic solutions. Our own business (Hexaware) provides a pre-built digital MRO suite with more than 150 KPIs covering most areas of a user’s maintenance and parts operations, including inventory and procurement. If a user were to try to build an in-house solution using BI (business intelligence) tools, it would probably take a year, but using a pre-built digital MRO suite, a BI or analytics package can be quickly rolled-out in less than eight weeks. The user can then continue to add capabilities to that package to cater their specific requirements for certain KPIs and dashboards.
BIG DATA AND ITS RELATIONSHIP TO CLOUD COMPUTING
There have been many advances in analytics, and today, while using predictive analytics for aircraft maintenance, some airlines and MROs are also moving towards prescriptive analytics to tell them what maintenance needs to be done on aircraft.
But before we deep dive into more advanced analytics, let us look at the capabilities of, sensors and IoT (Internet of Things) devices in the market today – they will capture close to 1 billion gigabytes in 2016. A lot of data, you might think. However, this data volume is forecast to grow to about 98 billion gigabytes a year in the next ten years. To process these huge data volumes will need capabilities far beyond the traditional databases that support M&E systems today, or using current BI tools and programming languages to analyze data.
Big Data
If we consider what ‘big data’ is, we can describe it with three ‘V’s:
- Volume – just one aircraft engine with sensors will generate 20 terabytes of data in real time, per day, per aircraft. So imagine the volume of data that will be flowing into users’ databases. There is no way that current databases can handle this volume of data.
- Velocity – the speed at which the data is generated and transmitted; roughly 1 terabyte of data per hour for just that one engine. Not only is the data high volume, but it is transmitted to the database at great speed.
- Variety – there are many different types of data being generated all of the time such as line maintenance data, engine data, aircraft health data, pictures, videos, text, etc. It is almost impossible to process all of this without tools and systems designed to handle big data.
Applying Cloud computing to the challenge of big data
What is the connection between big data and cloud computing? Analyzing big data can potentially lead to big profits, but is it worth the time and money needed to undertake that analysis? To process this huge amount of data to run, say, a monthly report using Hadoop* to analyze this data and find some meaningful insights from it might take 100 computing hours. However, there are alternative ways to get this type of job done:
- The first option is to build a 10-node Hadoop cluster and keep it in-house so that the job can be completed in about 10 hours. However, the cluster will then be idle for the rest of the month, i.e. utilized for 10 hours and idle for 720 hours.
- The second option is to build a 100-node Hadoop cluster in the cloud so that the job can be completed in 1 hour, after which that cluster is terminated, so a user only pays for one hour of computing resources used.
With the cloud option, users gain access to more processing power to process more data, but don’t have to invest in a multi-million dollar data warehousing solution. Big data and cloud computing work together with the vast amount of data handled in a maintenance and M&E system to produce the best processing option available today.
Predictive Analytics in Aircraft Maintenance
Predictive analytics can be summed up in the phrase, ‘What will happen next?’ There are various predictive models including the one that Hexaware uses, the Association model. This model takes all the historical defects and maintenance defects, and tries to associate each failure with a series of failures. Using a data mining process, it shows that, say, a particular strut in the landing gear has failed but, before that, a hydraulic piston had failed, which led to the failure of the strut. The Association model is one such model in predictive analytics that tries to find relationships or associations between various recurrences of failure data.
Similarly, it’s possible to use various models that are available and provide an output which can be run through the ETL mechanics who can give a weight to each of the outcomes, and predict future fail rates.
Prescriptive Analytics in Aircraft Maintenance
This is all about ‘how to do it better’. Once the user knows what is going to fail, they then want to know what the best way to fix it would be. For most airlines with the newest jumbo jets, the cost of downtime for an aircraft will be around $10k per hour. Prescriptive analytics use sensor data, logistics information from M&E systems, and various predictive algorithms to tell the mechanics exactly what steps to execute, the right time to do so, and the correct tools to use. This can help reduce unplanned downtime by almost 18%.
A CASE STUDY – PREDICTIVE AND PRESCRIPTIVE ANALYSIS USING SENSOR DATA
The challenges
Now that we’ve looked at some of the technical aspects of advanced analytics, and what they are capable of achieving in aircraft MRO / M&E, let’s look at a success story with a case that, while unrelated to aircraft, is a very interesting example of how Hexaware applied advanced predictive and prescriptive analytics for a client using sensor data.
The client is a leading US based mining company and one of the world’s largest copper producers. The company faced a number of challenges in their operations including their alarm systems. Every year, on average, there had been 173,000 alarms, with sensors getting activated by the mobile equipment monitoring system.The alarms had to be reclassified to ensure that the response was timely and effective.
Another problem area happened to be sudden engine failures on their haul trucks which caused a lot of unscheduled downtime and loss of productivity, because the trucks play a very important role in mining and need to be well maintained. As a result, it was necessary to identify indicators of engine failure and what the probability of failure would be, given certain states and events which occur over the engine’s lifetime. In addition to this, regular maintenance, such as engine oil changes, were critical to prevent excessive wear and tear which could have led to a failure.
Also, a lot of excessive idle time was identified with the haul trucks: these are times when, for various reasons, haul trucks remain idle during operation periods. The objective here was to seek out instances that were avoidable and to effect corresponding changes to the operational process. The haul trucks have to make trips from their base to the mining area and return with the copper, but while traveling from one point to another, there were instances when trucks used to overshoot the standard cycle time. Realizing the importance of meeting those times, an analysis was undertaken to reduce the cycle time. The resulting solution entailed the application of around 200 sensors per truck (there were 300 trucks spread over seven mining sites), each sensor generating 10,000 readings per second. This level of sensor data gathered cumulatively amounted to almost 10 terabytes of data over three years.
The solutions
The client already had an enterprise data warehouse running on a Teradata platform, supporting multiple analytic workloads. Hexaware leveraged this infrastructure and implemented a Hadoop 17-node Hortonworks cluster as the data platform which was used to store, cleanse and process the high volumes of sensor data. We also developed statistical analysis models and machine learning models using R language.
Alarms
First we classified the various alarms based on certain characteristics derived from text mining of historical alarm reports analyzed using the Hadoop and R language. The data used for this analysis was mainly the alarm data, the annotations and the status reports of the events.
Engine failures
The next challenge was predicting engine failures. We undertook multiple predictive modeling techniques such as ‘Random Forest’. This technique was employed to identify and segregate scenarios into high, medium, and low risk types, and their indicative features were used to predict when a haul truck engine could fail. Also, to determine the best time for an engine oil change, we used statistical analysis such as correlation analysis and regression analysis, including oil analysis to determine the levels of iron, lead, and oxidization in the oil.
Idle time
Sensor data was captured and aggregated to identify idle time, when the engine is running but the truck is stationery or not engaged in loading and unloading activities. A matrix of idle time duration was constructed highlighting which trucks had a longer idle time. Similar to the effort of reducing the cycle time for the haul trucks, specific sensor information such as strut pressure, GIS (geographic information systems) information and the speed of the trucks along particular road segments were taken to perform a triangulation of data, and analysis was done to identify the root causes of high cycle time. Based on this, available options included coaching the drivers, fixing specific spots in the roads (often damaged by the heavy haul trucks that move on them), or to fix the haul trucks themselves.
The results & Impact:
The alarms were re-classified into five categories based on the various clusters:
- Critical;
- Warning;
- Operational;
- Scheduled;
- Information.
These steps resulted in a huge fourfold reduction in the maintenance team’s workload. While this was started as a pilot project at one site, it was eventually rolled-out to all seven of the client’s sites because, the unplanned downtime at the pilot site was reduced by more than 50% compared to the other sites.. Our analysis identified an optimal time for engine oil changes, as well as various operational practices that used to cause problems, leading to a standardization of processes throughout all the client’s sites.
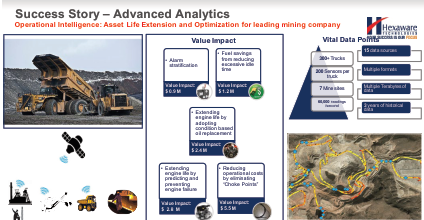
Over $10m in savings
Our solution saved our client more than 10 million USD on running costs and capital expenditures through asset life extension and improved productivity. Though this example is of a mining company, the same kind of solution can easily be incorporated into an airline or MRO setting as the types of equipment are different, but the problems are similar.
CASE STUDY – MRO INVENTORY OPTIMIZATION
The inventory management challenge
Managing inventory is one of the biggest challenges for airlines and other service providers. Parts availability can have a major impact on the operations and lead to an aircraft on the ground. An inventory of $1 million USD per aircraft is considered to be a normal, but, as readers will know, inventory can pile up pretty soon if it not properly managed. Most MRO systems come with inventory planning and forecasting models but they are often not effective due to various reasons.
First, the core function of any M&E system or application is maintenance, not inventory forecasting or optimization. Second, the type of information used for forecasting in such a system does not use extensive data. Typically, they have a more traditional way of forecasting inventory data which just uses historical consumption data. There are other generic inventory optimization solutions available, but there is nothing specifically suited for the airline industry. Considering all these factors, Hexaware came up with a more specific solution optimized to suit aircraft maintenance and spare parts requirements.
The inventory management solution
Using this solution, it is possible to achieve up to a 20% reduction in inventory for a large airline or MRO service provider. For a smaller business, the reduction might be around 10-15%. The key difference in this solution is the different type of data that it uses to optimize inventory levels. Along with data on inventory and historical consumption, it also uses past and future maintenance data, aircraft reliability data, aircraft utilization, and other parameters.
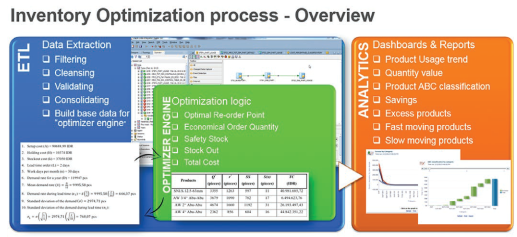
This solution can be quickly implemented and savings can be achieved within a few weeks. The solution comprises three components:
- The automated ETL (extract, transform and load) component that contains all the ETL jobs and integrates with the M&E system to extract the data required by the core optimization engine. There is an option to import data into an Excel sheet, CVS file, or text file. The data gets filtered and cleansed, validated and consolidated until the base data is finally generated in the form required by the optimization engine. This data can be extracted daily to get near real-time data. Most of the data required by the ETL component is available in most M&E systems.
- The optimization engine, written in R language, runs the complex algorithm and achieves the savings using a Continuous Review Model. This processes the input data, uses a complex algorithm and throws out recommendations in the form of inventory re-order points, economic order quantities and min-max levels for inventories. These recommendations can then be filtered at a detailed level before they are imported into the M&E system.
- Information Delivery that projects advanced analytical dashboards on inventory forecast and future savings. The output of the optimization engine is passed to an analytical model to present the trends and savings on a dashboard.
The optimization engine uses a continuous review model specifically built to optimize aircraft related tasks. It also takes into consideration certain external parameters such as service levels that can be set at a preferred service range. For certain parts, the user might want a service level of 95% and will thus set the service level parameter at 95. The system will take that into account when calculating the optimized inventory value. The inventory cost and AOG cost for certain parts and various other factors are also taken into account by the optimization engine. The optimization engine is also very easy to install and requires minimal hardware configuration.
At Hexaware, we believe that before the user even imports anything into the system, it’s important to see what the savings will be. Hence we built an advanced analytics dashboard which takes the output data from the optimization engine and processes it using a third step (see above) to display trends and analyses of savings in the inventory data.
MRO Inventory Optimization Solution
For brevity, this section skips the first and second steps above and goes directly to the output of the optimization engine to give you an idea of how savings can be achieved.
We have incorporated Inventory Optimization as a model in our overall MRO Analytics pack which has various other areas, but this solution is specific to inventory optimization. Our Inventory Optimization solution has four sub-tabs.
The first is the ‘Overview’ tab providing a high level overview of the current inventory and how much it would be possible to save (in this case $10.05 million USD on a $35.59 million inventory). We used test data based on actual aircraft MRO data. The ‘Overview’ tab also provides the minimum inventory value that the user has to maintain according to the recommendation of the current MRO M&E system (see min-max values above), and how much reduction could be achieved from current inventory levels. In the historical consumption analysis of inventory data, it’s possible to drill down to different categories of parts, a specific ATA chapter, or a specific part.
Next is the ‘Savings’ tab which gives a more detailed breakdown of how the savings shown in the Overview tab can be achieved. It shows ‘Savings in current Inventory – monthly trend’ as seen below.
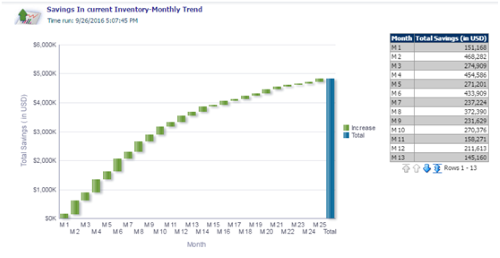
The Savings tab also shows potential savings by month in monetary value for the next 25 months, and this period can be increased. During the initial few months, the potential savings are high until the inventory is optimized, after which the savings trend becomes smaller and steady.
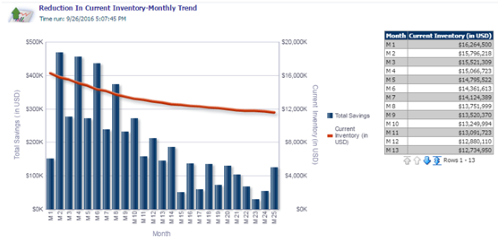
The next tab shows ‘Reduction in current Inventory – monthly trend’. This provides details on how the inventory will be reduced. The red line shows current inventory and how it will reduce over 25 months.
‘Savings on current inventory value’ provides information on the savings for each category, and it’s possible to drill down to the chapter level, or even further to the part level.
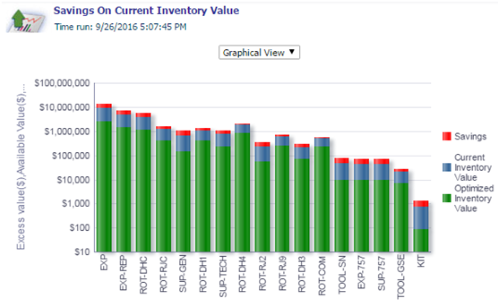
Drilling down to the part level also helps identify and concentrate on those parts that can provide maximum savings. These can be sorted based on potential savings to provide more detail.
Then there is the ‘Reduction range in % for parts (quantity)’ and ‘Reduction range in % for parts (US Dollar value)’. These tabs tell users the percentage of reduction that can be achievable. For example, with the parts represented in the third column of the Quantity table, it would be possible to save 50% of the quantity, while, with the parts represented in the first column of the US Dollar value table, it would be possible to save 25% in dollar value. If we click on, say, the third column by quantity, the system will take you to the part level and show how much reduction is possible.
Next step is the ‘Analysis’ tab which provides detailed analysis of the inventory, such as ‘Inventory value by category’, ‘ABC classification by category’ where we can see the parts by categories and can drill down to the chapter level and the individual part level.
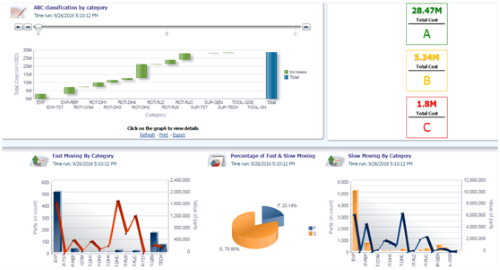
The drill down can be applied across several reports and the criteria for the drill down can even be changed or customized. Scrolling down provides other dashboards such as the ‘fast moving’ parts and the ‘slow moving’ parts categories. It also shows a comparison between fast and slow moving parts, and in this case, 80% of the inventory is slow moving — which is not optimal — and indicates that it has been badly managed.
Finally we have the ‘Export’ tab which allows the export of inventory values calculated by the optimization engine in various formats such as XML (which is accepted by most M&E systems) or Excel or PDF or any other popular formats. The user can first evaluate the data before moving it to the M&E system for further processing.
CONCLUSION
This article not only shows how the next big transition in Airline MRO Analytics, from descriptive to predictive to prescriptive, can improve efficiency, profitability and reduce costs, but also shows, how that work in practice through the case studies.
* Hadoop is an open-source software framework for storing data and running applications on clusters of commodity hardware. It provides massive storage for any kind of data, enormous processing power and the ability to handle virtually limitless concurrent tasks or jobs.
(Source: SAS).
Contributor’s Details
 Baiju Jacob
Baiju Jacob, Director – Global Travel & Transportation at Hexaware, has more than twenty years of experience in IT consulting in the Travel and Transportation Industry. In his many years within the industry, he has worked in various roles including consultant, program management and practice development. Baiju leads the MRO practice for Hexaware globally with a focus to provide innovative solution frameworks for the MRO Industry in key areas for their business transformation needs.
 Manuel Fernandes
Manuel Fernandes has more than twenty years of experience in IT consulting with domain expertise in Supply Chain Management (SCM) and Aircraft Maintenance, Repair & Overhaul (MRO) business areas. He has delivered MRO systems Transformation and Migration projects for major airlines and MRO service providers. Currently, Manuel is leading the MRO Practice and Solutions division at Hexaware and built the MRO Data Warehouse, MRO Analytics, Inventory Optimization, Mobility, Migration Frameworks, Automation Test Suites and Advanced Analytics Solutions.
With operations in nine countries and a focus on very select industries such as the Airline and MRO industry Hexaware helps customers through its business process, IT and consulting services to achieve greater efficiency and better outcomes. Hexaware has proven expertise in application transformation management (ATM), legacy modernization, advanced analytics, product engineering, digital assurance, infrastructure, management services, digital and business process services to deliver solutions for passenger travel, ticketing & reservations, cargo, revenue management, crew management, MRO, baggage and airport operations.
Comments (0)
There are currently no comments about this article.
To post a comment, please login or subscribe.