Articles
| Name | Author | |
|---|---|---|
| CASE STUDY: The path to new in-flight fuel savings at Transavia France | Capt. de Norman, Pilot, Transavia | View article |
| CASE STUDY: Greater fuel efficiency at SAS | Svein Erik Jackwitz, Fuel Efficiency Specialist, Scandinavian Airlines and David Rytter, CEO, AVTECH | View article |
| CASE STUDY; PLAY Airlines gets efficiency and future-proofed | Halldor Gudfinnsson, Director Flight Operations and Tómas Ingi Gunnarsson, Supervisor Dispatch, both at PLAY Airlines | View article |
| CASE STUDY: Lufthansa City Airlines: A new document solution | Dominik Weber, Head of Flight Operations Support & Administration, Lufthansa CityLine and Maike Upmann, Product Manager, Lufthansa Industry Solutions | View article |
| CASE STUDY: Good weather information when you need it | Martin Gerber – Pilot / Project Manager – Swiss International Air Lines | View article |
| WHITE PAPER: EFB and the rise of new technologies | Klaus Olsen, CEO, EFB Admin Services | View article |
CASE STUDY: Greater fuel efficiency at SAS
Author: Svein Erik Jackwitz, Fuel Efficiency Specialist, Scandinavian Airlines and David Rytter, CEO, AVTECH
SubscribeSAS implements a new flight profile optimizer and Svein Erik Jackwitz, Fuel Efficiency Specialist, Scandinavian Airlines and David Rytter, CEO, AVTECH explain how it went
Svein Erik Jackwitz
In addition to being a fuel efficiency specialist, I also pilot the Airbus A320, giving me a unique perspective on fuel efficiency from both the technical and operational sides. However, before we dive into the case study itself, I’d like to give you a quick introduction to the airline that is the subject of the case study.
SCANDINAVIAN AIRLINES (SAS)
Scandinavian Airlines (SAS) operates a fleet of 130 aircraft composed of the below types.
| Aircraft Type | # of aircraft |
| A320 | 75 |
| A321LR | 3 |
| A319C | 4 |
| A320C | 8 |
| A350 | 4 |
| A330 | 8 |
| B737 Medevac | 1 |
| E195 | 10 |
| CRJ | 17 |
| ATR | 6 |
Like many airlines, SAS has faced significant challenges in recent times, especially following the pandemic. The company emerged from Chapter 11 bankruptcy protection in early 2024, marking a new chapter in its history. Despite these hurdles, SAS is determined to regain its market position and continue its journey toward becoming Scandinavia’s preferred airline.
Now, with a clear focus on recovery and growth, SAS is working diligently to secure its place in the competitive airline industry. A key part of this strategy includes a collaboration with Air France-KLM, which aims to strengthen market presence and enhance service offerings. Throughout these challenging times, SAS has remained steadfast in its commitment to sustainability. The airline has continued to invest in sustainable practices and innovative solutions for eco-friendly flying. This dedication to sustainability is integral to SAS’s vision for the future, ensuring that the airline not only recovers but also leads the way in sustainable aviation.
THE FOUR PILLARS OF THE SAS SUSTAINABILITY PROGRAM
The SAS Sustainability Program is founded on four key pillars aimed at reducing the environmental impact of air travel: fleet renewal, operational efficiency, the use of Sustainable Aviation Fuel (SAF), and fostering innovations and partnerships.
Fleet renewal focuses on updating the fleet with modern, efficient aircraft. These advanced aircraft reduce fuel consumption and carbon emissions, making aviation more environmentally responsible. Operational efficiency optimizes flight operations through strategic planning, route optimization, weight management, and maintenance practices. This reduces fuel consumption, minimizes delays, and improves the passenger experience. Using Sustainable Aviation Fuel (SAF) can reduce CO2 emissions by up to 80% compared to traditional jet fuel. Incorporating SAF is a significant step toward achieving carbon reduction goals. Innovations and partnerships leverage data-driven models and collaborations with industry partners to enhance sustainable practices. Technological advancements and cooperative efforts are crucial for long-term sustainability in aviation. In summary, the SAS Sustainability Program’s pillars – fleet renewal, operational efficiency, SAF usage, and fostering innovations and partnerships – create a robust framework for a more sustainable aviation industry.
Advances in Simulator Training and Fuel Efficiency: a two-year review
Two years ago, an update was made to the SAS simulator training program with the goal of increasing awareness and refining flight operations. This update included a comprehensive review of all training initiatives and the operational strategies for flying aircraft. As part of this enhancement, a collaboration with AVTECH was established and their ClearPath solution subsequently implemented in 2024. This partnership introduced advanced technologies and methodologies into the training regimen, aiming to improve overall flight efficiency and performance.
A key component of the ongoing evaluation involved applying a model to assess the impact of these initiatives. This model compared flown sectors from 2019 with those flown in 2023, focusing on specific aircraft types. Adjustments were made for weight and distance variations, recognizing that even same sectors can have different distances. The model utilized a weighted average approach, giving greater weight to aircraft that frequently flew certain sectors and less weight to those with limited sector activity. This method provided a more accurate assessment of performance improvements. The results demonstrated a significant enhancement in fuel efficiency. From 2019 to 2023, fuel efficiency improved by 1%. Building on this progress, fuel efficiency increased by an additional 0.25% from 2023 to 2024, particularly within the neo fleet. These advancements reflect a commitment to continuous improvement in training programs and operational practices, contributing to increased efficiency and environmental stewardship in the aviation industry.
Fuel efficiency improvements: a comparative analysis of flight data
An analysis of flight data reveals significant improvements in fuel efficiency over recent years. Each data point in the analysis represents a specific flight, providing insights into fuel consumption patterns. (Figure 1)
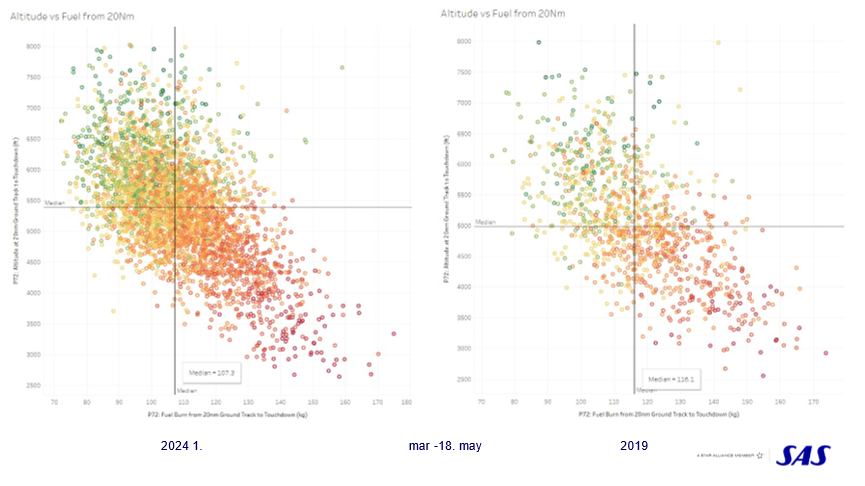
Figure 1
During the period from March 1 to May 8, 2019, the median fuel burn for A320neo aircraft from 20 nautical miles (Nm) to landing was 116.1 kilograms. In contrast, the same median fuel burn during the equivalent period in 2024 decreased to 107.3 kilograms. The targeted operational parameters for pilots included maintaining an altitude between 5,500 and 6,500 feet at 20Nm from landing, while traveling at approximately 240 to 250 knots. The data indicates that pilots adhered well to these guidelines, resulting in fuel consumption that could potentially drop below 100 kilograms. This improvement is attributed to the adoption of landing configurations such as flaps 3 and full flaps, which are currently standard practice. Encouraging the use of flaps 3 landings, which may further reduce the median fuel burn towards 100 kilograms, is an ongoing objective. Efforts to promote this practice include publishing articles, discussing the benefits, and showcasing successful implementations. The aviation community has responded positively, recognizing the mastery of these techniques as a valuable skill.
WORKING WITH CLEARPATH
A test period for the ClearPath system was conducted from December 2022 to May 2023, marking a significant phase in evaluating its effectiveness.
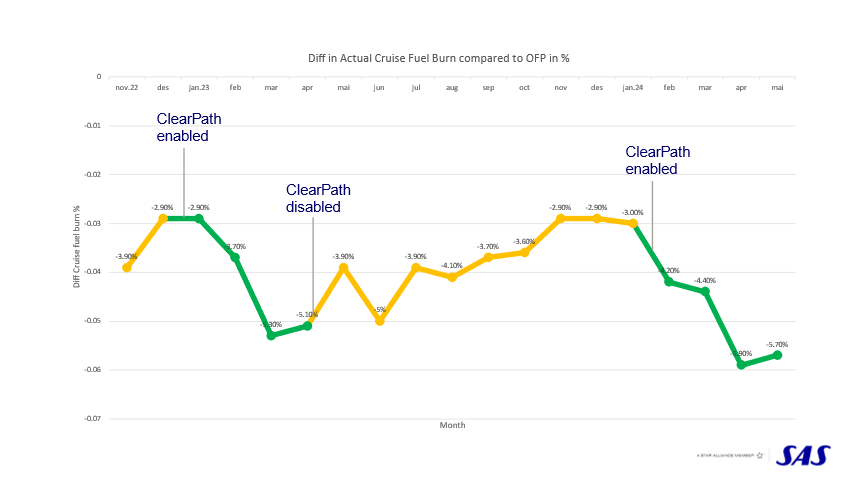
Figure 2
COLLABORATION WITH CLEARPATH: A SIX-MONTH REVIEW
Initially, as depicted in Figure 2, the data from December and January showed some variability in fuel consumption, likely due to transitional factors in implementing the system. However, by the Spring of 2023, there was a notable reduction in cruise fuel consumption compared to the Operational Flight Plan (OFP). This improvement was attributed to both the technical capabilities of ClearPath and its user-friendly presentation in the cockpit. The system provides a printout that serves as a visual reminder to optimize the vertical profile during flight.
The adoption of ClearPath was favored not only for its clarity but also for the absence of additional hardware investment, making it a straightforward and comprehensible tool for pilots. Despite some fluctuations in fuel burn from May 2023 to January 2024, the overall trend indicated a positive impact, with a particular improvement observed from January 19, 2024, when the same pilots who participated in the previous year’s trial continued to use the system with even better results.
While there is a recognition that the program is still evolving and that results for long-haul flights with the A330s, which began in April 2024, have yet to show similar improvements, the ongoing commitment to data-driven analysis and continuous publication of findings are essential for realizing the full benefits of the program. Figure 3 illustrates the desired behavioral changes resulting from the ClearPath implementation, highlighting the progress and areas for further development.
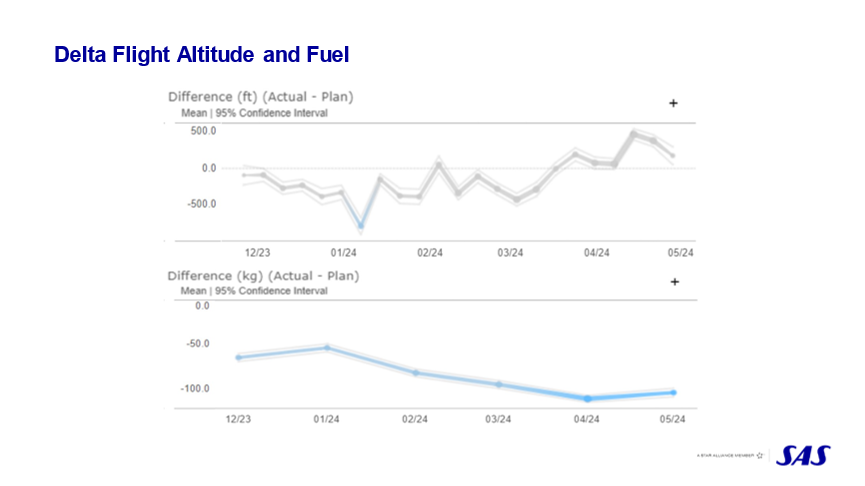
Figure 3
EVALUATING FLIGHT PERFORMANCE AND SAVINGS POTENTIAL WITH CLEARPATH
An analysis of flight performance relative to the Operational Flight Plan (OFP) reveals significant insights. The data, illustrated in Figure 4, indicates how altitude adjustments have impacted fuel consumption. From December to March, flight altitude was initially lower than the OFP recommendations. However, as time progressed, the altitude was increased, resulting in flights being conducted at higher altitudes than suggested by the OFP. This adjustment mirrors the pattern observed during the previous year’s test phase. The impact on fuel burn during cruise phases was also notable; while January showed a higher-than-expected fuel burn, the overall trend remains positive, reinforcing SAS’s confidence in ClearPath as a valuable investment.
Additionally, Figure 4 presents a savings potential graph, highlighting the optimization opportunities within 9,660 flights. Of these, 8,248 flights were already operating at optimal levels according to the OFP, underscoring the effectiveness and potential of further optimization through ClearPath.
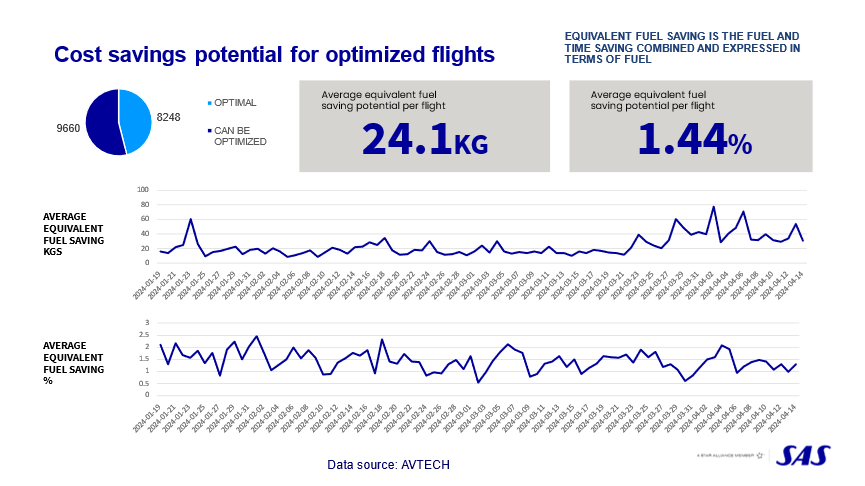
Figure 4
Potential for Additional Savings: Analyzing Flight Optimization
Analysis indicates a significant opportunity for further savings through flight optimization. Flights identified as candidates for optimization demonstrated an average equivalent fuel saving of 24.1 kilograms, which translates to a 1.44% reduction. Equivalent fuel saving accounts for both time and fuel savings. For instance, using more time may result in a fuel saving of approximately 20 kilograms; however, if this extra time extends the flight by an additional minute, the average equivalent fuel saving may decrease. Conversely, simultaneous reductions in both time and fuel consumption contribute to a higher equivalent fuel saving. This nuanced understanding highlights the potential for optimizing flight operations to achieve more substantial fuel savings while balancing time efficiency.
OPTIMIZED FLIGHTS: A COMPARATIVE ANALYSIS
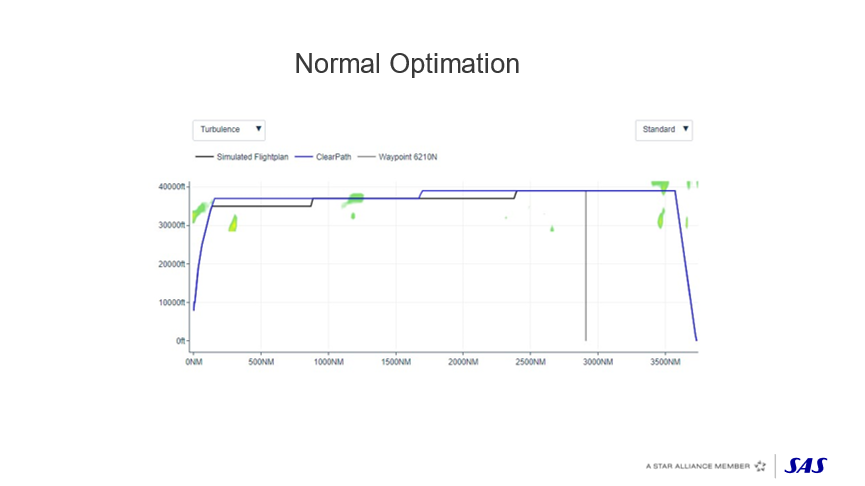
Figure 5.1
Figure 5.1 illustrates a typical example of flight optimization. The graph compares the Operational Flight Plan (OFP) with ClearPath’s optimization recommendations. In the graph, the black line represents the OFP guidelines, which suggest an initial climb to approximately 34,000 feet, followed by a further ascent to 36,000 feet at around 88 nautical miles (Nm). In contrast, the blue line depicts ClearPath’s approach, which advocates an initial climb directly to 36,000 feet and then maintaining that altitude for a shorter distance than the OFP recommends. This comparison highlights how ClearPath’s optimization modifies the altitude profile for improved efficiency. The graph provides a detailed view of the flight analysis dashboard, while the pilots’ perspective and operational message received from ClearPath is shown in Figure 5.2.
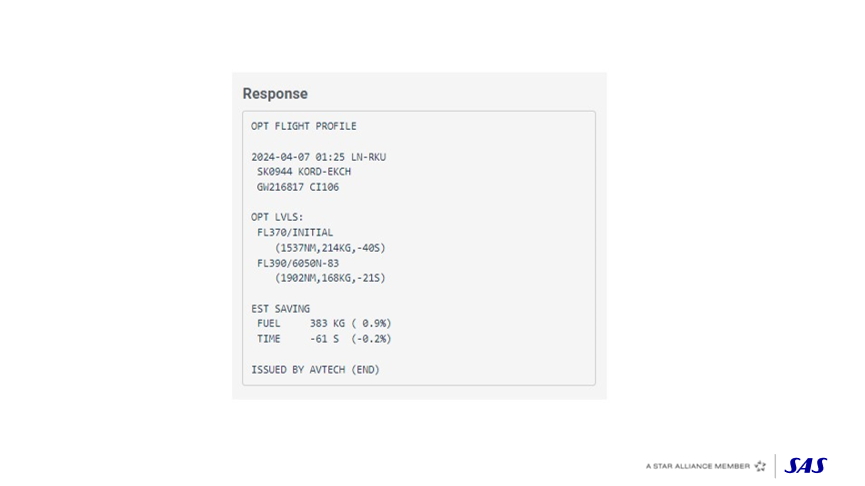
Figure 5.2
ClearPath Cockpit Message: Flight Optimization Example
Figure 5.2 illustrates the ClearPath interface message received in the cockpit for a flight from Chicago to Copenhagen. This message provides detailed optimization recommendations to the pilot. In this example, ClearPath suggests an initial altitude of Flight Level 370. The second level recommendation proposes climbing to Flight Level 390, along with specific instructions on where to make this adjustment. Additionally, the system provides estimates for fuel savings at each altitude level, as well as the corresponding time impact on the flight. For this flight, ClearPath estimated a total fuel saving of 383 kilograms with a time increase of just one minute (61 seconds). However, it is often observed that optimizing altitude can result in both time and fuel savings. ClearPath serves as a valuable, data-driven tool that pilots can consult to make informed decisions, balancing optimization recommendations with operational factors such as schedule adherence.
Turbulence Awareness: Enhancing Pilot Feedback and Safety
Turbulence awareness has become a prominent focus in flight operations, with ClearPath offering significant enhancements in this area. This feature has garnered positive feedback from pilots, reflecting its value in improving flight safety and comfort (see Figure 6).
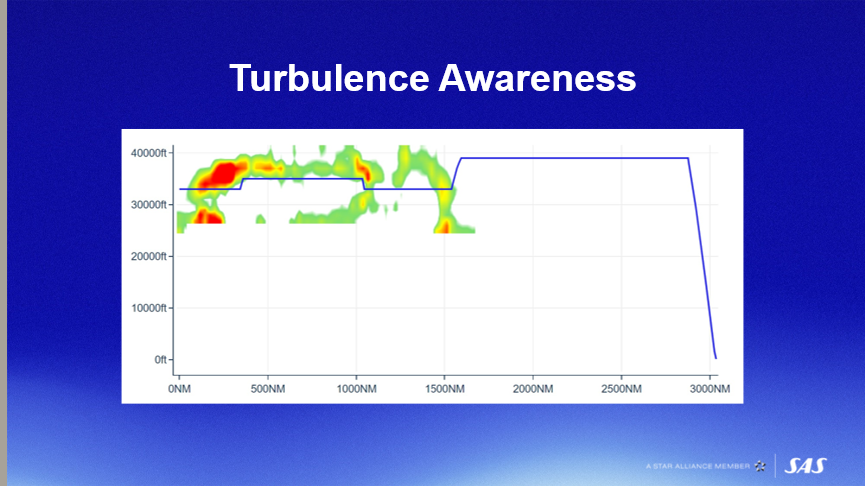
Figure 6
AVTECH TURBULENCE CLASSIFICATION AND ITS APPLICATION
AVTECH has established a system for classifying turbulence into three categories: light turbulence (20 to 31 units), moderate turbulence (32 to 44 units), and severe turbulence (45 units or higher). These thresholds are customizable by airlines to suit their specific requirements and operational preferences. Different levels of turbulence trigger varying ClearPath responses in the cockpit, enhancing the pilot’s ability to manage and respond to turbulence effectively. Figure 7.1 provides an example of this system in action during a flight from Athens to Copenhagen, illustrating how these turbulence classifications are applied in real-world flight scenarios.
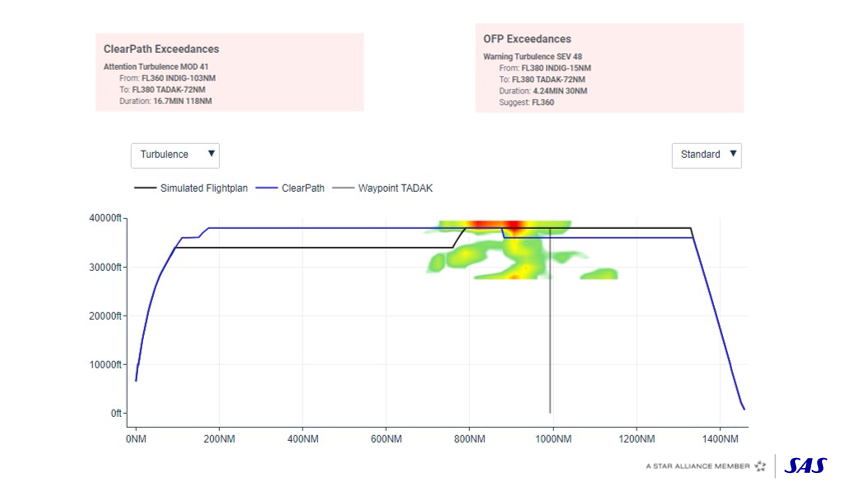
Figure 7.1
ClearPath Turbulence Response System: Enhancing Flight Safety
The ClearPath Turbulence Exceedance system provides pilots with detailed responses on how to manage turbulence effectively. For example, a response might read, “Attention, Turbulence, MOD (moderate) 41,” indicating moderate turbulence with a specific intensity level. The system informs pilots of the expected turbulence location who can then make pre-emptive safety measures (seatbelts, service suspension etc.), however, it does not recommend altitude changes for this level of turbulence.
In contrast, when the Operational Flight Plan (OFP) suggests, in the above example, an initial lower altitude, with a step climb into potentially stronger turbulence, while ClearPath advises maintaining a higher altitude until approaching severe turbulence and then descend below the turbulence area. For severe turbulence, the system might display a warning like, “Warning, Turbulence, SEV (severe) 48,” and recommend altitude adjustments. In the above case, if the optimal altitude was higher after the turbulence area, ClearPath would suggest a new higher altitude. In this case it was deemed safe, and cost optimized to maintain the current altitude until the top of descent.
Figure 7.2 illustrates the cockpit message of these turbulence warnings, providing pilots with clear and actionable recommendations to navigate turbulence safely and effectively.
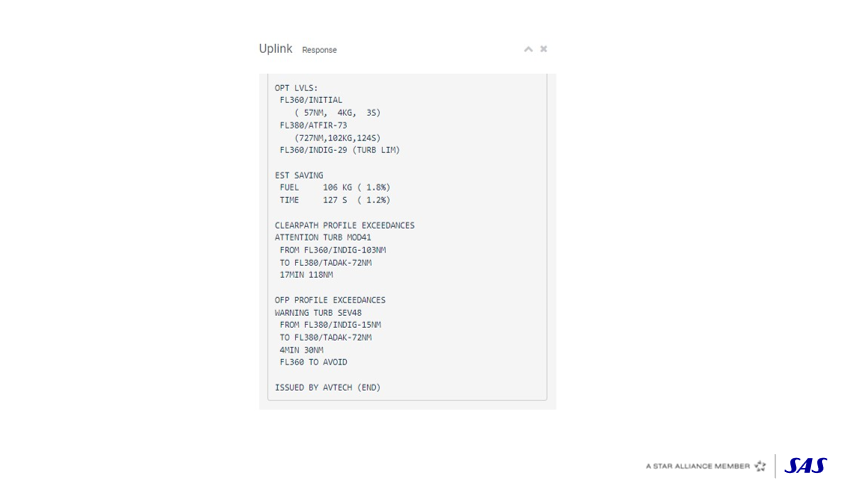
Figure 7.2
ClearPath Turbulence Responses and Temperature Optimization Challenges
The ClearPath Turbulence Exceedance system displays standard details at the top of the message, followed by specific turbulence warnings. For example, the system first provides an ‘Attention’ alert, followed by a more critical ‘Warning’ if necessary, to guide pilots through turbulence management.
Temperature Challenges:
In northern Norway and Sweden, particularly from December to March, flights face significant challenges due to extremely cold temperatures. The transition from operating the Boeing 737, which can handle temperatures as low as -73°C, to the Airbus A320, which has a lower operational limit of -70°C, posed some difficulties. During the test period last year, ClearPath’s optimization sometimes exceeded the Airbus A320’s environmental limits. However, with prompt calibration and adjustments from AVTECH, a revised model was quickly developed, as illustrated in Figure 8. This adjustment ensures that ClearPath’s optimization remains within the Airbus A320’s operational envelope, addressing temperature-related challenges effectively.
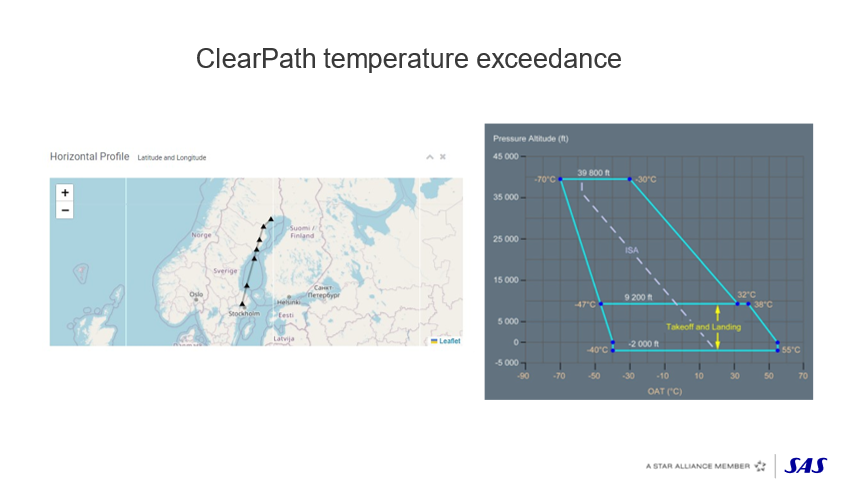
Figure 8
ClearPath Temperature Warnings and Optimization
The updated ClearPath model now includes temperature warnings, which have been implemented effectively. Figure 9.1 illustrates how these warnings are displayed.
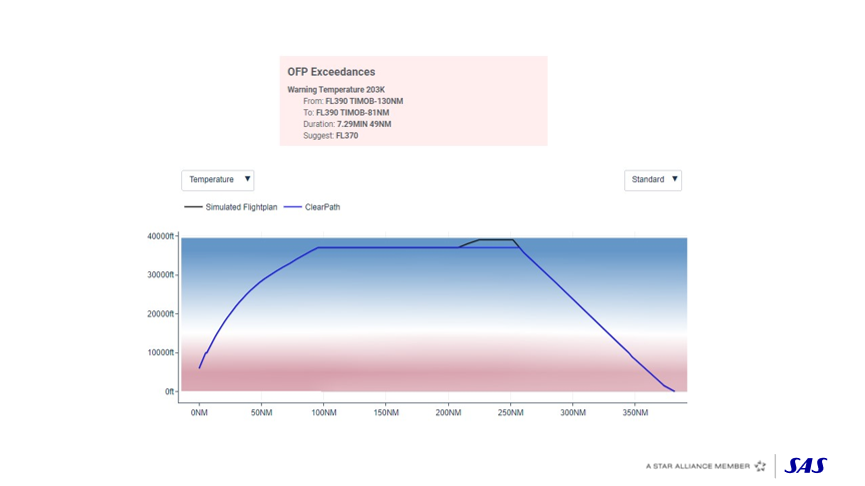
Figure 9.1
In the interface, the system provides details on OFP exceedance, highlighting warning temperatures. For instance, ClearPath suggests avoiding climbs towards the end of the cruise if it would take the aircraft into excessively cold regions, offering alternative routes to prevent entering temperatures beyond the aircraft’s operational limits. This proactive approach ensures that flights remain within the temperature envelope. As a result of these optimizations, no flights have exceeded the temperature limits. Figure 9.2 shows the response message, reflecting the adjustments and recommendations made by ClearPath to maintain safe operational parameters.
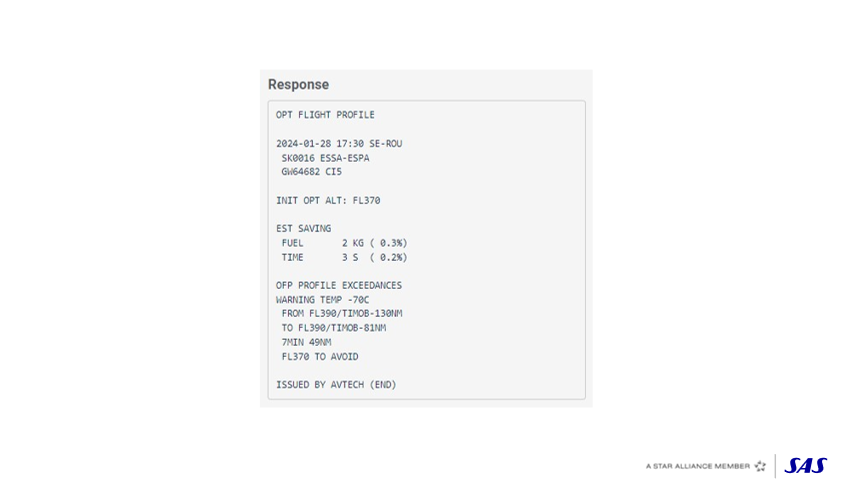
Figure 9.2
POSITIVE EXPERIENCE WITH CLEARPATH IMPLEMENTATION
The implementation of ClearPath has been highly successful for SAS, reflecting a positive experience in collaboration with AVTECH. Svein Erik Jackwitz comments, “Whenever issues arise, such as temperature-related challenges, the response from AVTECH has been prompt and effective. For instance, when we encountered temperature problems, sending a simple email to AVTECH in the morning typically resulted in a solution by the afternoon.” This efficient support has greatly contributed to the smooth integration and ongoing success of the ClearPath system.
WHAT IS CLEARPATH?
ClearPath is an advanced real-time flight path optimization tool that operates seamlessly with existing aircraft technology. Designed to enhance operational efficiency, ClearPath provides pilots with a cost-optimal flight path based on cost index, weight and active route sourced directly from the aircraft FMC. If the cost index changes in flight, ClearPath can adjust accordingly and thus supports dynamic cost index operations.
The system employs a ground-based architecture capable of performing millions of computations by utilizing the aircraft’s performance model and real-time parameters. This data is combined with a high-resolution 10k and 1h weather forecast (the industry standard is 140k and 3h) to optimize the flight path. One of ClearPath’s unique features is its ability to automate the delivery of optimization recommendations directly to the cockpit via ACARS, eliminating the need for pilot engagement. However, manual requests can be done at any time to retrieve a ClearPath optimization on ground and in-flight. The typical use case for the in-flight request is after changes of route, gross weight, or CI. The system is effective for both short and long flights, with results deliverable to an EFB, printer, or MCDU screen. Airlines using this solution can achieve fuel and CO2 reductions of approximately 2.5% during the cruise phase.
HOW DOES CLEARPATH WORK?
Figure 10 shows the essence of ClearPath’s operation.
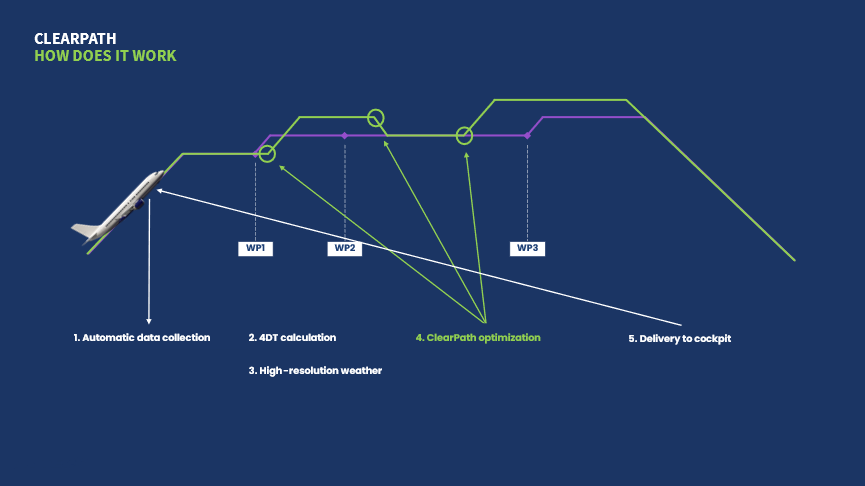
Figure 10
In the climb phase, ClearPath automatically downloads data (CI, weight, and active route) from the on-board flight computer. This data is used to calculate the 4-dimensional trajectory of the flight, and high-resolution weather forecasts are retrieved for the exact flight path of this specific flight. ClearPath optimizes and finds the optimal altitudes and step points, then uplinks this information back to the pilots in the cockpit via ACARS.
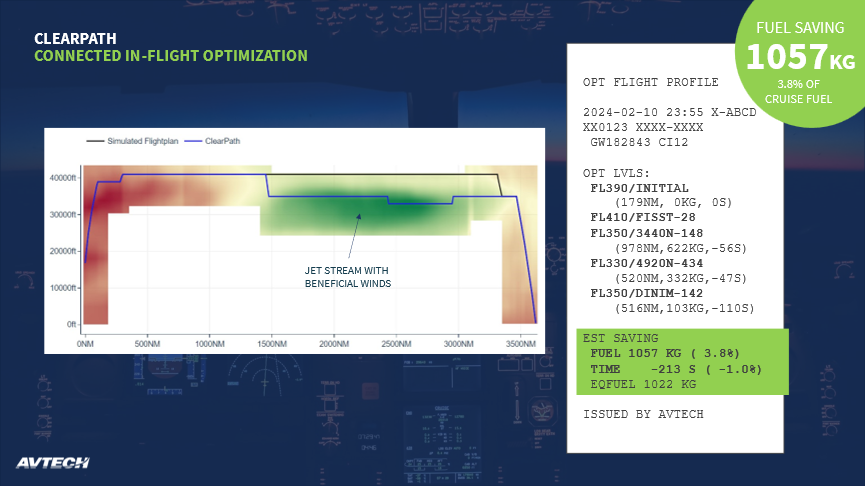
Figure 11
ClearPath is user-friendly, and easy to understand. In the case shown in Figure 11 of a Boeing 787 flight with a low cost-index (12), following the ClearPath recommended optimal altitudes and step points (depicted in blue) allowed the pilots to save over a ton of fuel (3.8 percent of cruise fuel) for a minimal time penalty of just two and a half minutes on a almost nine-hour flight. The figure shows how the information can be provided to the pilots as a printout, on the MCDU screen or in the EFB.
ClearPath offers additional features such as speed optimization, contrail avoidance, and the avoidance of inflight hazards. These hazard features include turbulence avoidance and temperature avoidance. Figure 12 presents a real example of a flight using the hazard avoidance service.
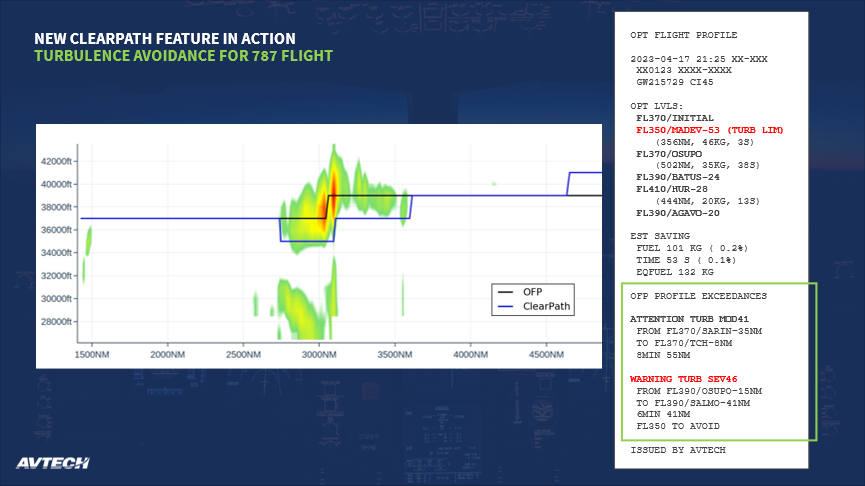
Figure 12
The OFP path is depicted as the black line in the figure, with a planned step that would pass through severe turbulence. The ClearPath in-flight message shows a warning, alerting the pilots to the severe turbulence along the path. Additionally, the service provides the most cost-optimal way to avoid that turbulence, which, in this case, involves a step down to flight level 350, as shown by the blue line.
Comments (0)
There are currently no comments about this article.
To post a comment, please login or subscribe.