Articles
| Name | Author | |
|---|---|---|
| Case Study: Achieving Operational efficiency at SAS via a fully supported document management solution | Carina Dahlqvist, Publishing Manager, SAS Group Operations | View article |
| Case Study: Using Big Data to drive efficiency at Volotea | Jordi Garcia, Operations Engineering Analyst A319, Volotea | View article |
| Case Study: Digital efficiency in flight operations, safety and compliance | Florence Baudin, Legislation and Quality Representative, Luxair; and Santiago Mesa, Sales Executive — Aeronautical Engineer, Web Manuals | View article |
| Case Study: Optimizing Statistical Contingency Fuel at Lufthansa Cargo | Michael Lingemann, Fuel Efficiency Manager, Lufthansa Cargo; and Delyan Savchev, Data Scientist, Honeywell | View article |
Case Study: Optimizing Statistical Contingency Fuel at Lufthansa Cargo
Author: Michael Lingemann, Fuel Efficiency Manager, Lufthansa Cargo; and Delyan Savchev, Data Scientist, Honeywell
Subscribe
Michael Lingemann, Fuel Efficiency Manager, Lufthansa Cargo and Delyan Savchev Data Scientist, Honeywell explain what has driven the program and how it works
We’ll tackle this article in two parts. First we’ll consider how Lufthansa Cargo (the airline) approached the topic of contingency fuel; then we will cover some background information on the statistics. But first, some brief facts and figures about Lufthansa Cargo.
LUFTHANSA CARGO
There are around 4,600 employees in the business with a fleet of 17 aircraft: 12 MD11 and 5 Boeing 777 with a further two 777s scheduled for delivery in 2019. EBIT (Earnings Before Interest and Taxes) is around €240m and, more pertinent for the subject in hand, is that 20 per cent of Lufthansa Cargo’s costs are accounted for with fuel, the cost of which amounts to €326m. That’s a significant cost so there is always an incentive to reduce it and an interest in any program offering the chance to improve performance on this front. The airline serves over 300 destinations but that includes the entire Lufthansa Group network because, while 50 percent of Lufthansa Cargo’s cargo is transported on the freighters, fifty percent goes into the holds of passenger flights. There are some 12.9bn Freight Ton Kilometers Offered (FTKO) and about 8.9bn Freight Ton Kilomenters Transported (FTKT): the overall Loadfactor is around 70 percent.
WHY INTRODUCE ANALYSED CONTINGENCY FUEL (ACF)
Now, jumping into the main topic, and what motivated Lufthansa Cargo to introduce Analyzed Contingency Fuel (ACF). At the time of writing, the implementation was not completed but was in the final phase, however, we’d like to share how it has gone so far and how the issue has been tackled.
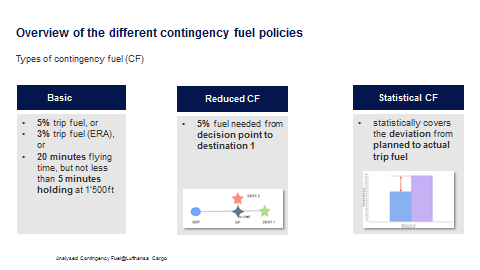
First, what is the purpose of contingency fuel? The classic definition states that ‘Contingency fuel is loaded for deviations from planned and actual trip fuel’, i.e. for unforeseen factors. They might be deviations from forecast weather conditions, deviations from the planned route or from planned cruising levels and/or altitudes. In general, it’s loaded for deviations between planned and actual demands on fuel: this is the classic definition of contingency fuel.
Most of the contingency fuel policies used by Lufthansa Cargo are in the OFPs (Operational Flight Plans) as in figure 1.
In fact, in a couple of months following the time of writing, all contingency fuel policies were planned to be in the OFP because the airline will have a statistical program (see below) being implemented and this will reduce many of the other fuel policies but not always. There has to be a statistical sample size behind the data and where there have only been, say, ten flights using that policy type, there won’t be any statistical contingency fuel. That’s why airlines are forced to stick with some old methods because it will not be possible to substitute everything behind it in the future. That said, Lufthansa Cargo calculates that about 80 per cent of flights will be run under statistical contingency fuel.
We won’t go through the classic methods with which readers might well be familiar but figure 2 shows the current distribution for contingency fuel policies for the two fleets at Lufthansa cargo.

Depending on the fleet, the airline makes less use of 20 minutes contingency for the MD11 and, for the B777, it is used more with more China routings which are longer. So, it depends on where the aircraft is flying and how it is being flown. At the time of writing Lufthansa Cargo used all contingency fuel policy types except Analyzed Contingency Fuel (ACF) or Statistical Contingency Fuel (SCF); but is getting there with those.
The chart in figure 3 was created by Michael to show the current situation. So what does it show?
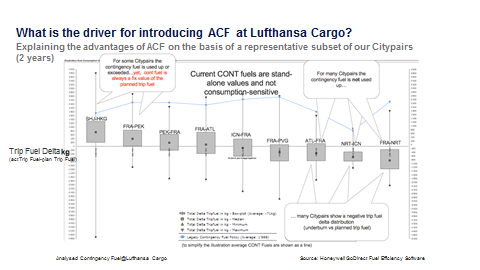
The boxes represent Delta Trip Fuel and the distribution of the Delta Trip Fuels by routings over a period of two years. You’ll see the minimum values of Data Trip Fuel as well as the maximum values and the ‘center of gravity’, the boxes that contain 50 percent of the Delta Trip Fuels. It gives a good idea of the data spread currently of those representative city pairs that were used. Delta Trip Fuel is defined as actual trip fuel minus planned trip fuel.
What readers will see is that the city pairs on the left tended to over-burn, for example Sharjah-Hong Kong, and they have a fixed amount of contingency fuel. The contingency fuel never adapted to what is actually consumed so that, for the next flight there will always be the same amount (5%, 20 minutes…): it’s not consumption sensitive. Some of the city pairs cited will usually burn up all of their contingency fuel while for others, on the right of the chart, such as Frankfurt-Narita, the contingency fuel was hardly ever used up and yet the same amount was always loaded; there is no flexibility. This was an issue that Lufthansa Cargo wanted to tackle and with Statistical Contingency Fuel there is a framework with which those fixed values can be replaced. However, it’s important to know that this framework is not like a recipe that tells users how to treat the data in detail or how to treat the statistics behind it: there’s nothing about sample sizes, how big a sample size has to be used to administer ACF. What kind of normalization to do, factorization, standardization; how to model the data behind… this is all something we’ll cover below. In general, an airline will have to negotiate with the local regulator as to how ASCF and/or SCF will be implemented. It is necessary to file an agreement and to show all of the data and documentation in support of that. For the future, Lufthansa Cargo’s aim is to find the balance between safety and economy plus, the whole thing should be sensitive to fuel consumption.
Taking all that into account, the chart from figure 3 has been modified for figure 4 with the percentiles introduced.
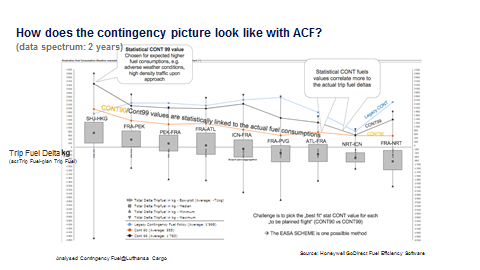
The orange line is the 90 percentile while the black line is the 99 percentile. As can be seen, they directly link to actual fuel consumption: rather than being a fixed value they are completely corresponding to actual fuel consumption. It could be said that 90 percent of trip fuel data are below the orange (90 percentile) line and 99 percent of trip fuel data lies below the black (99 percentile) line. But of course, not all of Lufthansa Cargo city pairs are on the chart: it’s just a representative sample.
When does the airline use CONT90 (Contingency 90) and when CONT99? Lufthansa Cargo’s plan is to follow the EASA scheme, a decision tree constructed by EASA which takes into account the weather situation, visibility, cloud ceiling, whether there is an ERA airport available and runways with ILS. This is going to be implemented in the airline’s flight planning software, LIDO, then it can be decided which percentile is going to be used. So, one could roughly say that 90 percent is more for the standard conditions and the 99 percent is for adverse conditions.
ACF Process Cycle at Lufthansa Cargo
In figure 5, you can see Lufthansa Cargo’s basic process cycle.
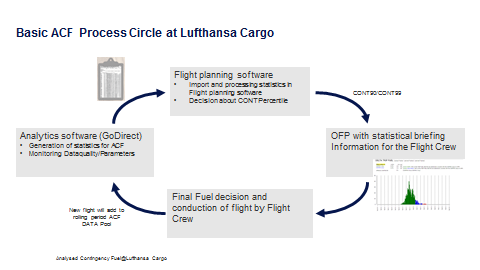
There is analytical software on the left of the chart, Honeywell Forge for Airlines, and in that software, Lufthansa Cargo produces the table that goes into the Lido Flight Planning System. Lido then decides whether for the next flight it will take the CONT90 value or the CONT99 value, the result of which is printed on the OFP. Parallel with that, the pilots are shown dashboards about distribution (below right on the table) which is important in the context of building up trust in the data: the crew has to see how the value CONT99 looks in a distribution for this specific city pair; otherwise, if there’s no trust, there will be a counter reaction. All that said, the final fuel decision still remains with the crew but the hope is that the better process will offer a better picture of what they need to make that decision. So, when the flight is conducted and creates a new sub-set, this goes back into the software and there is data monitoring with quality checks and so on. It is important to build a program behind it that monitors the whole process.
Current stage for implementation and next steps
Statistical metrics and analytics have been developed together with Honeywell and made ready, and there is also a data quality program underway to watch all ACF involved parameters. The next step will be the testing of the integration of the new system with the flight planning software which, at the time of writing, was looking very good – as we’ve already said above, it will be necessary to provide data and charts to the crews and set up the communication program, a very important element to explain how ACF works. Of course, a flight safety risk evaluation has to be done and then the plan was to go live in the first quarter of 2019.
Now, let’s look at the statistics behind ACF.
DATA PREPARATION, VALIDATION AND STATISTICAL ANALYSIS OF CONTINGENCY FUEL
As we’ve already seen, there is a process that has to be followed in order to introduce ACF. There are regulations that need to be understood and there is, of course, data preparation, data validation and statistical analyses to be done, the last step but not the least important.
From the point of view of the software provider, there first needs to be a correct calculation, the calculation needs to be integrated into the flight plan and then, from the software point of view, there needs to be proper support, proper validations, proper troubleshooting tools to ensure that the data is always being calculated correctly (a simple example would be where there are old aircraft, it might not deliver good resolution of the FDM data, it might be necessary to use burn-based values or a variance of those values).
As a first step for each flight (figure 6) the corrected Trip Fuel Delta will be needed.
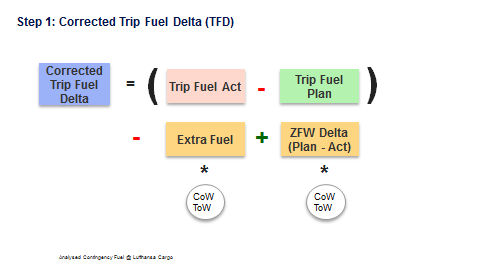
There is the actual trip fuel and the planned trip fuel and the difference between them would be the Delta. However, if the weather was bad and there was additional fuel put on at the last minute, then that needs to be corrected with the Cost of Weight (CoW) and the Take-off Weight (ToW) of the fuel because the Delta will be greater. On the other hand, if the flight has been planned with more passengers but, actually some of them didn’t show up, then there will need to be another Delta which has been calculated in the flight planning system with the weight of the passengers being a certain amount and that also needs to be corrected.
This is the first step to building the trip fuel Delta because, at the end of the day, there can be different averages, i.e. per flight, per city pair, a combination of city pairs and aircraft type… however, it will be necessary to take into account the variance and the arrival time as well as the airport at which the flight lands. Arriving at Heathrow in the morning is one thing: arriving in Sofia is quite different. There are many different correction that could be put in here, for example, the planned ground distance and the fuel bias correction factor for the engine… there’s a lot that can be done but it’s still normalization of variables that are meant to stabilize the trip fuel Delta.
Then, one of the most important things that can extend behind the scenes is, opening the EASA regulation or any other ICAO regulation, they say, ‘we want recent data to be weighted more than past data’. So that, when something happens like a routing change, or if fuel burn has drastically increased in the past 6 months or if the routings have changed because of some events, the data from a couple of years ago should be less weighted less than the more recent data.
In short, there is no fixed recipe. There are many options: an airline could take the full two years, and weight them linearly with say the first flight having a weight nearer to zero and the last flight nearer to two to give an average of one. But then you might want to include seasonality or have a rolling period, every three months; those data will need to be updated for the specific city pairs and aircraft type. At the same time there might be different winter and summer schedules, different fuel, planning procedures for these, so these are all important elements and, for that reason, it’s never ‘one size fits all’. Every operation is different with, perhaps, some flights that are seasonal, some that are not or some in between.
For this part, figure 7 shows a real example from Lufthansa Cargo; the whole story has been divided into five periods.
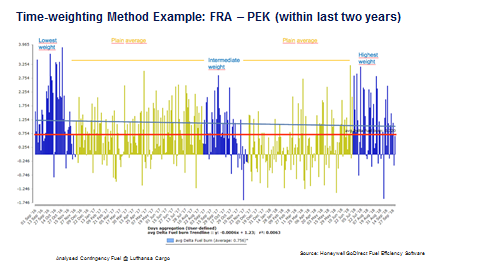
Figure 7
The most recent three months are on the far right in blue which have been accorded the highest weight. Then there is some intermediate data which are just the plan average and with a fixed weight of 1. Then there is an intermediate weight that is a bit lower than 1 and then, the data on the far left is accorded a lower weight. In this way, the whole spectrum of data is included with, of course, care taken to calculate the correct variance so that, at the end of the day, when values are calculated, the aim is for the Delta at the end of the day to go to zero.
In addition to all that, the data has to be cleaned, normalized for different parameters (figure 8); also, distributions need to be considered so we’ll try to explain the concept of distributions.
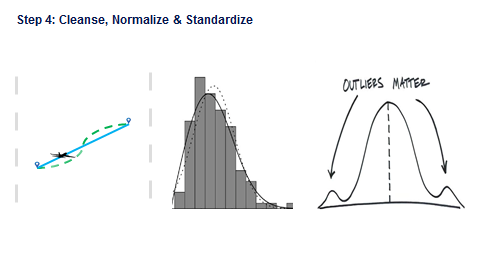
Figure 8
On the very right side of the chart it says ‘Outliers matter’ because, if we think about how airlines plan their passenger weight on the flight. They’ll say, there are 200 passengers and each passenger with their baggage will be 100kg. But that average does not tell the whole story because the variance between different individuals can be significant and that needs to be incorporated in the calculations. Reports for management can show averages but averages in the analyses will not help achieve a tangible result. All of those things need to be considered.
Figure 9 shows a typical distribution of over one thousand flights – TFD stands for Trip Fuel Delta.
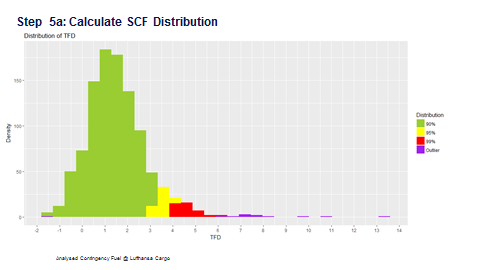
Figure 9
This is what you see on the X-axis: percentages of planned trip fuel and it’s very important to understand because the flight planning system works with planned amounts of fuel. It has to take into account different routing, different weather, the weight of the aircraft, etc. For example, looking at the green sector, that represents distribution to the 90th percentile which means that 90 percent of the flights have had trip fuel delta, actual minus plan with all the corrections, less than 3 percent. Then, the 95th percentile in yellow is between 2.7 and around 4.2. The 99th percentile represents 99 percent of Delta and, in purple, the outlier flights include some very large Deltas such as 10 percent or some very low Deltas such as minus 2 percent.
That all needs to be considered and now imagine all the combinations of fleet, route, or the combinations of city pairs and aircraft type plus, each of those blocks (the 90 percent, the 95 percent, the 99 percent, the outliers…) has different distribution and each distribution is different. You won’t see standard bell-curve distributions. All would be messy which is why we need smart statistical analysis and modern methodology in order to do that calculation. Averages won’t be enough because flight is a phenomenon that has many variables so, taking all that into account in figure 10…
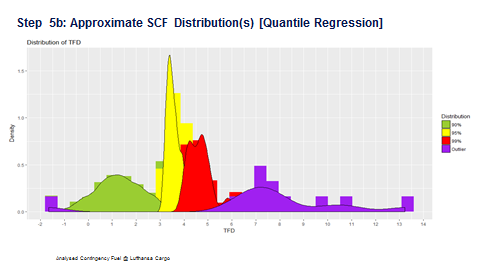
Figure 10
… the green distribution (the 90th percentile) looks more or less like a bell curve while the yellow, 95th percentile, is very narrow. The 99th percentile, the outlier distribution, in purple, is much larger if we calculated the weight between the lightest and the heaviest cases which is what has to be done. We have implemented state of the art statistical methodology with state of the art data preparation and validation in order to achieve that. Fortunately, at the end we get the right results to go into the flight planning system. So, for every combination of departure, airport arrival, airport and aircraft type, there will be a different percentile to go into the flight planning system and that is what we need. So, if you just look at the city pairs in figure 11…
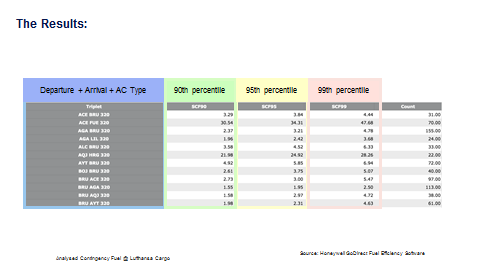
Figure 11
… first there is Lanzarote to Brussels (Note: example doesn’t use Lufthansa Cargo data) – where 90 percent of flights have had the trip fuel Delta less than 3.29 percent. But, on the second row, Lanzarote to Fuerteventura, two Canary Islands close to each other, around 100km apart, the 90th percentile is around 30 percent. On shorter flights, there are larger deviations; which is why we need a statistical program that can calculate this. We don’t want, every time to divide the flights into different brackets and then do it manually, and then come back, and report this information to management. We need a smart system that can do it for us.
Data validation
The story will not be complete if we don’t touch upon data validation (figure 12).
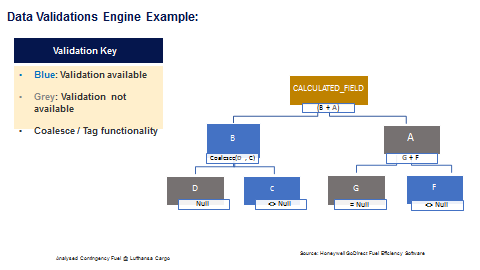
Figure 12
We have depicted in figure 12 a very simple tree with a three-fold usage. On the one hand there might be data fields which combined inputs from different data sources and, for those data fields, there needs to be validation. ‘Is my landing weight actual always greater than the aircraft operating weight?’ That’s something very simple but human error in the system will ruin your analysis. On the left there is a ‘B’ box where it also says ‘Coalesce (D, C) which means that if you don’t get the burn-based values, you’ll get the time-based values. So it’s important that the data validation engine is capable of handling such complicated trees behind the scenes, to be sure that the correct data is being used. And this can also be used for what is called ‘Tag functionality’, meaning, in the example above, burn-based versus time-based. If there are three, four, five hundred different validations for every data field that comes out of flight planning operations … the end data, will amount to 2 to the power of 500, an enormous number of data units; that’s why we need a smart engine and validation engine to do that. What Honeywell has done with its software is to combine all of those to do the work so that users can concentrate on Operations.
Last consideration: imagine something that happens with the QAR on an aircraft and the airline stops receiving FDM data. Honeywell’s system will simply send an email to the right person and it can be configured so that they’ll know something is happening and can go and check it. Once this is done, then the system helps align everyone on the same page with the fuel program.
Contributor’s Details
Michael Lingemann

Michael Lingemann has been a Fuel Efficiency Manager at Lufthansa Cargo since 2014. He holds a diploma in Process Engineering and, after a two year Training Program at Lufthansa Cargo, worked 10 years at Lufthansa network management. As of 2014 he has been working in fuel efficiency at Lufthansa Cargo with the expertise for analytical fuel efficiency software specifications and operational analytical knowledge.
Delyan Savchev

Delyan Savchev is an experienced statistician and data scientist with over eight years’ commercial experience solving business problems in IT and product marketing. He holds a PhD in Statistics and is part of the Flight Data Analysis team in Honeywell Aerospace’s flagship GoDirect Flight Efficiency platform. He enjoys flight data analysis, thus helping airlines to become more data-driven while keeping the level of scientific rigor in the analysis.
Lufthansa Cargo

Lufthansa Cargo AG is a German cargo airline and a wholly owned subsidiary of Lufthansa. It operates worldwide air freight and logistics services and is headquartered at Frankfurt Airport, the main hub of Lufthansa.
Honeywell
Honeywell International Inc. is an American multinational conglomerate company that makes a variety of commercial and consumer products, engineering services and aerospace systems for a wide variety of customers, from private consumers to major corporations and governments.
Comments (0)
There are currently no comments about this article.
To post a comment, please login or subscribe.