Articles
| Name | Author | |
|---|---|---|
| Case Study: Singapore Lessor (DAC) Eyes Further Digitalization | Jefferson Ding, Managing Director at Dragon Aviation Capital (DAC) | View article |
| Case Study: Engineer Training and Monitoring Solution Project at FL Technics | Liudas Jurkonis, Deputy CEO for Engineering, Design and Technical Training Department, FL Technics | View article |
| White Paper: IT systems adoption Part 3 | Allan Bachan, VP, Managing Director, MRO Operations, ICF | View article |
| WHITE PAPER: Sustaining aviation after recovery – part 2 | Gesine Varfis, Marketing Manager APSYS and Gabriel Godfrey, Product Owner – Sustainable Aircraft, APSYS | View article |
White Paper: IT systems adoption Part 3
Author: Allan Bachan, VP, Managing Director, MRO Operations, ICF
Subscribe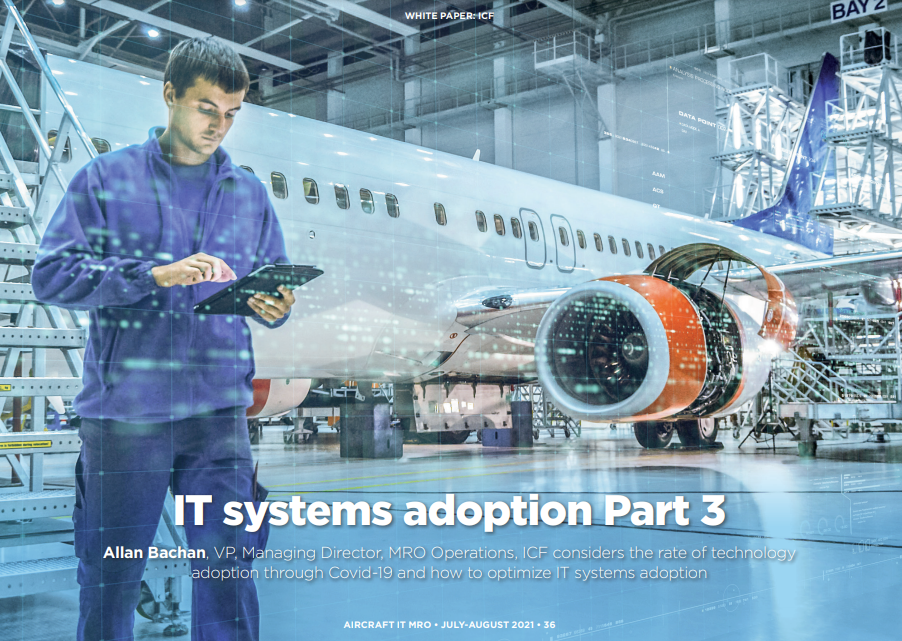
Allan Bachan, VP, Managing Director, MRO Operations, ICF considers the rate of technology adoption through Covid-19 and how to optimize system adoption
In parts 1 and 2 we covered discovering how well processes in the business are IT enabled as well as the adoption study and EPC support. In this final part we’ll look in detail at the seven key questions outlined previously with suggestions as to how users might be able to deal with each one. Then finally, we’ll summarize the Adoption Study and its potential to help users match software to functions, processes and tasks as well making full use of the IT assets already in the business
Drilling a little further into the seven questions outlined in part 2, let’s start with, how do you populate an EPC (Enterprise Process Center) with processes and software objects? In figure 15, there are some quick examples.
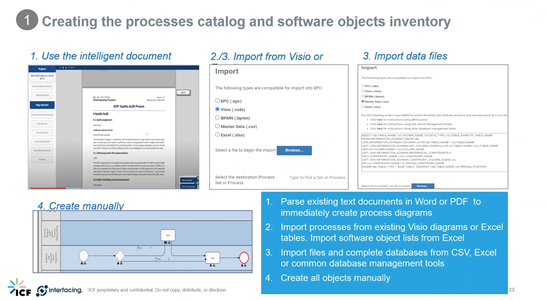
The first thing is to parse existing tech documents, that might be in Word or PDF, to quickly create process diagrams. This can be done using the intelligent document parser where it can easily read tech-based documents which, in the maintenance context, might be the GPM (General Procedures Manual), the Quality Control Manual, the MPM (Maintenance Planning Manual) the TPM (Technical Procedures Manual) or whatever it’s called in your organization, and then, using the intelligent document parser, you can map what the document looks like and interpret that as a process diagram. What can be seen in figure 15 is, number 1 becomes number 4 automatically in mere seconds; reading a text document which comes straight from the Word or PDF original.
Secondly, you can import processes from existing Visio diagrams or Excel tables. So, for example, if you have a list of all the screens that exist in the business, that can be put into Excel along with tables as well as all the configuration parameters and so on: profiles, attributes and settings can be imported very quickly and very easily which, in turn, facilitates you being able to do the mapping. Or, if you have your processes in Visio, there might still not be the level of detail that we’ve covered in the context of mapping, but you may have tasks and block diagrams and decision boxes, and you can import those. You will also see in figure 15 that the BPMN (Business Process Modeling Notation) standard can also be imported so that, if you are managing your processes in a BPMN compliant tool, it will also be a lot easier.
The third opportunity is to import complete databases from Excel or database management tools and, of course, there are several different ways to achieve that. As part of the implementation, ICF would look at your databases and, if it’s easier to connect with those databases and import the information using SQL Server Management Studio or DbVisualizer or the database management tools, we can do that as well.
And last but not least, we can create this manually. At ICF, we encourage creating manually as a manufacturing implementation because, to be honest, if you follow this methodology of how you are building the process and mapping it to the software, it becomes a learning process and opportunity for knowledge transfer… learning how to use the software in doing your job. It really is advantageous bringing this in and incrementally over the period of designing your ‘to-be’ solution: staff are actually learning the tool.
Once you have it in, then what you want to do is see how well those processes are performing: so, now we’ll get into building measurements and actually measuring how you’re doing (figure 16).
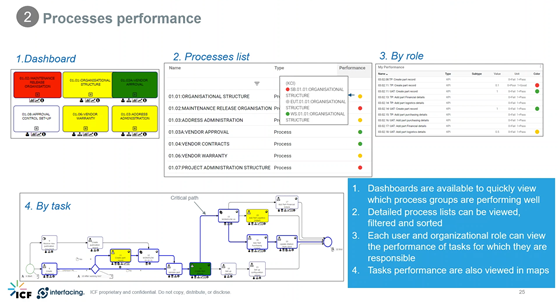
Dashboards are available to quickly view which process groups are performing well plus detailed process lists can be viewed and sorted. Each user can look at how their role is performing and this can be used for testing or for daily management in terms of how well these are performing. What is also good about these measures is that it is possible to connect them with the system directly and, if you have timings, then again that can feed this data. So, if the screen is supposed to refresh itself every three seconds, for example, but it’s actually taking ten seconds, then that would be flagged. It’s possible to connect these measures directly to the system for the tasks and, as users interact with these tasks using the system objects, then the system can be logging that information and reporting how it’s performing.
This can also be by task performance which can be reviewed in the maps. The task performances in figure 16 are the ones that are performing well, in green, or middle of the road performance in yellow, and the red ones are not doing well – a typical traffic light signal.
Next, we should ask how well are you using available systems and technology and how enabled are your processes from a technology standpoint? (Figure 17).
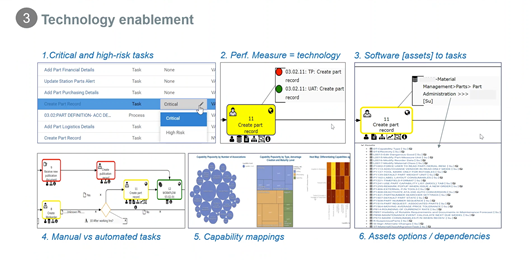
The first thing to do is to check high-risk tasks rather than looking at thousands of tasks: you want to identify the ones that matter – the important few versus the trivial many. It’s important to be able to flag those. If you don’t, that’s OK but we recommend that you should start performance measures around technology as the enabler of business tasks using the red, yellow, green traffic light signals.
Number 3 in figure 17 addresses the matter of software assets mapped to tasks. If you don’t have software mapped to tasks and you don’t have dependencies for the software options that you’re using, then it will be flagged by color to tell you whether these are enabled or the configuration options have been used or not. Of course, these are onscreen displays but you can have reports that you can extract as well once all of the data is in the system. At the bottom of the figure there are quick clicks, manual vs automated tasks, in the one that’s green you can see a little cog to indicate that the task is automated so that the system is generating the workflow. For the ones that are yellow, it is the user who is doing the transaction, pulling up the screen while the ones that are red are purely manual or do not have any software object that’s associated with them as far as tasks are concerned.
Capability mappings can be pulled to show where and how software is used; the size of the bubble indicates how often that software object is mapped to tasks, if it’s used very frequently, whether it impacts several things across the process groupings and that also tells you the level of importance. The 80/20 rule can be used here to identify the items that will have a bigger impact and to be able to manage these improvements in the future.
How well do users know processes, systems and procedures and how easy is it for them to navigate and be able to do their tasks? (Figure 18).
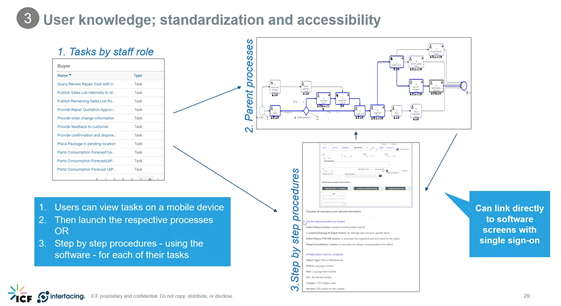
Users can view tasks on a mobile device or any device to see all the tasks they have to perform and, once they click on it or touch it on the screen, they can get to what parent process it belongs to and a step-by-step procedure that shows screenshots of what needs to be done. Then, touching the screenshot, the application can be launched directly. So, if I’m using any software system, I can simply execute that task very easily as a user by interrogating my daily tasks. Step-by-step procedures will allow me to navigate directly to the user content and then, from the user content, I can follow. This is a huge advantage when it comes to several end users and being able to standardize the way people do things; and, of course, all of this content will be on a continuous revision cycle.
If someone has an issue with the content that they’re viewing, perhaps it’s not working or not working fast enough, they can log an item and collaborate in order to get that resolved. People are using it, realizing things that go on with it and want to start to improve it. The question is, how well are you managing improvements to processes: if there is a helpdesk then it should have an ‘issues log’ to identify where work needs to be improved and who needs to be trained. But how good would it be if all this was live and you had a more structured or diligent way of doing it?
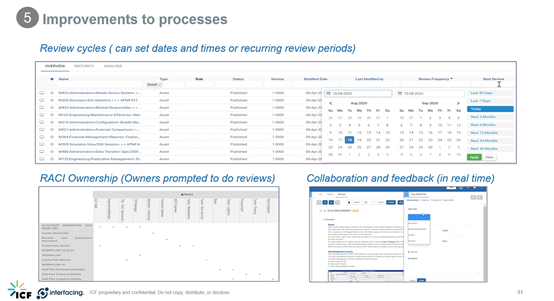
All of this would result in ownership that can be assigned and owners having different objects that they can own; they can own software objects, they can own tasks, they can own processes for the areas that they are managing; and each owner or each object will have a review and revision schedule. Review schedules can be set for every three months, every six months or whatever frequency is considered suitable, as in the example in figure 19, or specific review dates can be set for the future. Each owner will receive an email reminder that they have these things to review by whatever date has been set. Then they will have to go through the processes, the tasks or the software objects for which they’re responsible. And, as they do that review, then they can feedback using the collaboration tool in real time to say, ‘I want to raise a discussion, an improvement request, an incident or pose a question’ (bottom right in figure 19). Those items can be raised immediately for a QR (Quality Review) to the people who have to make the revisions of the items and/or resolve them. This is all in real time, so you have review cycles, ownership and real-time collaboration with anyone who is responsible for doing this.
Readers will know that aircraft maintenance or MRO is a very regulated space; so, you need to be sure that you’re compliant with policies, rules and regulations as they change. Just as there are linkages of the software assets to the tasks and processes, we must also link policies and rules which can be FARs (Federal Aviation Regulations), Airworthiness Notices, Advisory Circulars or any sort of information that govern the way that things are done (figure 20).
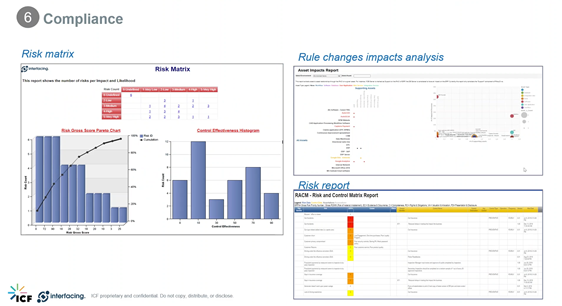
Similarly, users can do impact studies and can assign a matrix of risks, items that carry a higher risk as a result of the rules and then, when the rules change, can do an impact analysis across every object, which may be tasks or processes. They’ll then get a risk report to say which ones should be addressed as a high priority because of the risks that have been assigned to them. This is very similar to the review cycle (see above) so can be setup in a similar manner.
How do you stay up-to-date with revisions, changes and updates? Again, we can consider an impact analysis (figure 21) for which, if you have implemented all of the foregoing, you will know all of the dependencies which includes rules and it includes software which also includes, of course, tasks that you may do and processes that you may have plus revisions you may be making to those processes.
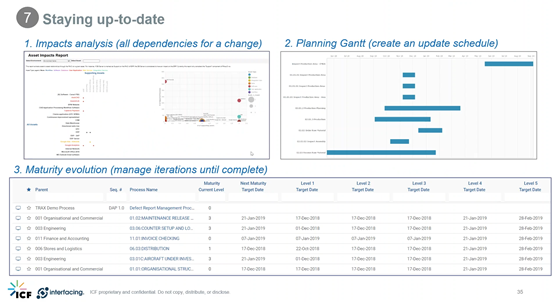
And then, if you know what they are, you can set up a planning calendar for doing those things. There will be owners for the items on that calendar and each owner can now know when they have to do something because something has changed. The maturity evolution can be tracked; so, for the example in figure 21, it’s level 1, level 2, level 3; different levels, and those levels can record different priorities for changes that have to be done. For Maturity evolution, the system has to be updated first and then documentation, data, training. The ownership structure, the schedule, the impact, the risk… are all managed within the tool itself as part of the continuous improvement cycle.
CONCLUSION
To summarize, an Adoption Study gives a good snapshot very quickly of how well your business is enabled for technology. Also, it defines paths to improvement which, of course, is how you will address this moving forward. It will help to see areas of weakness or strength and includes how you are performing because the processes are documented as are all your departmental functions; the performance of your business processes, the level of IT enablement and automation, any gaps with regard to value added or high-risk tasks at a true level of detail needed to formulate a strategy and plan which you can manage within here. Your entire governance cycle of that improvement is also built within the tool. You can prioritize by the level of worth and magnitude to remedy using the chart to determine the volume of work that you have to do for those changes.
Contributor’s Details
Allan Bachan

Allan is a Vice President at ICF with 32 years of industry experience as an Aviation M&E, MRO and Supply Chain solutions and systems domain expert. He is responsible for ICF’s MRO Operations and IT practice and he manages the Aircraft Commerce Consulting relationship with ICF. His experience includes managing application design, development, and full cycle implementation – from selection to go-live – for strategic clients in the MRO industry using different commercially available MRO IT products. In his career, Allan has fulfilled the following leadership roles: MRO IT practice and technical lead; MRO systems Product Principal; M&E and MRO Solutions Director and Manager of Technical Records, Maintenance Planning and Production Control.
ICF

ICF is a global consulting services company with more than 5,500 specialized experts, who are not typical consultants. They combine unmatched expertise with cutting-edge engagement capabilities to help clients solve their most complex challenges, navigate change and shape the future.
Comments (0)
There are currently no comments about this article.
To post a comment, please login or subscribe.